#
Main. Cluster Chart
The SKARB Cluster Chart is valuable in intraday trading and for manage medium-term and long-term positions. The cluster chart allows the trader to determine the price range of the largest traded volume, assess the supply and demand in the market, and make trading decisions based on the detailed values of the cluster.
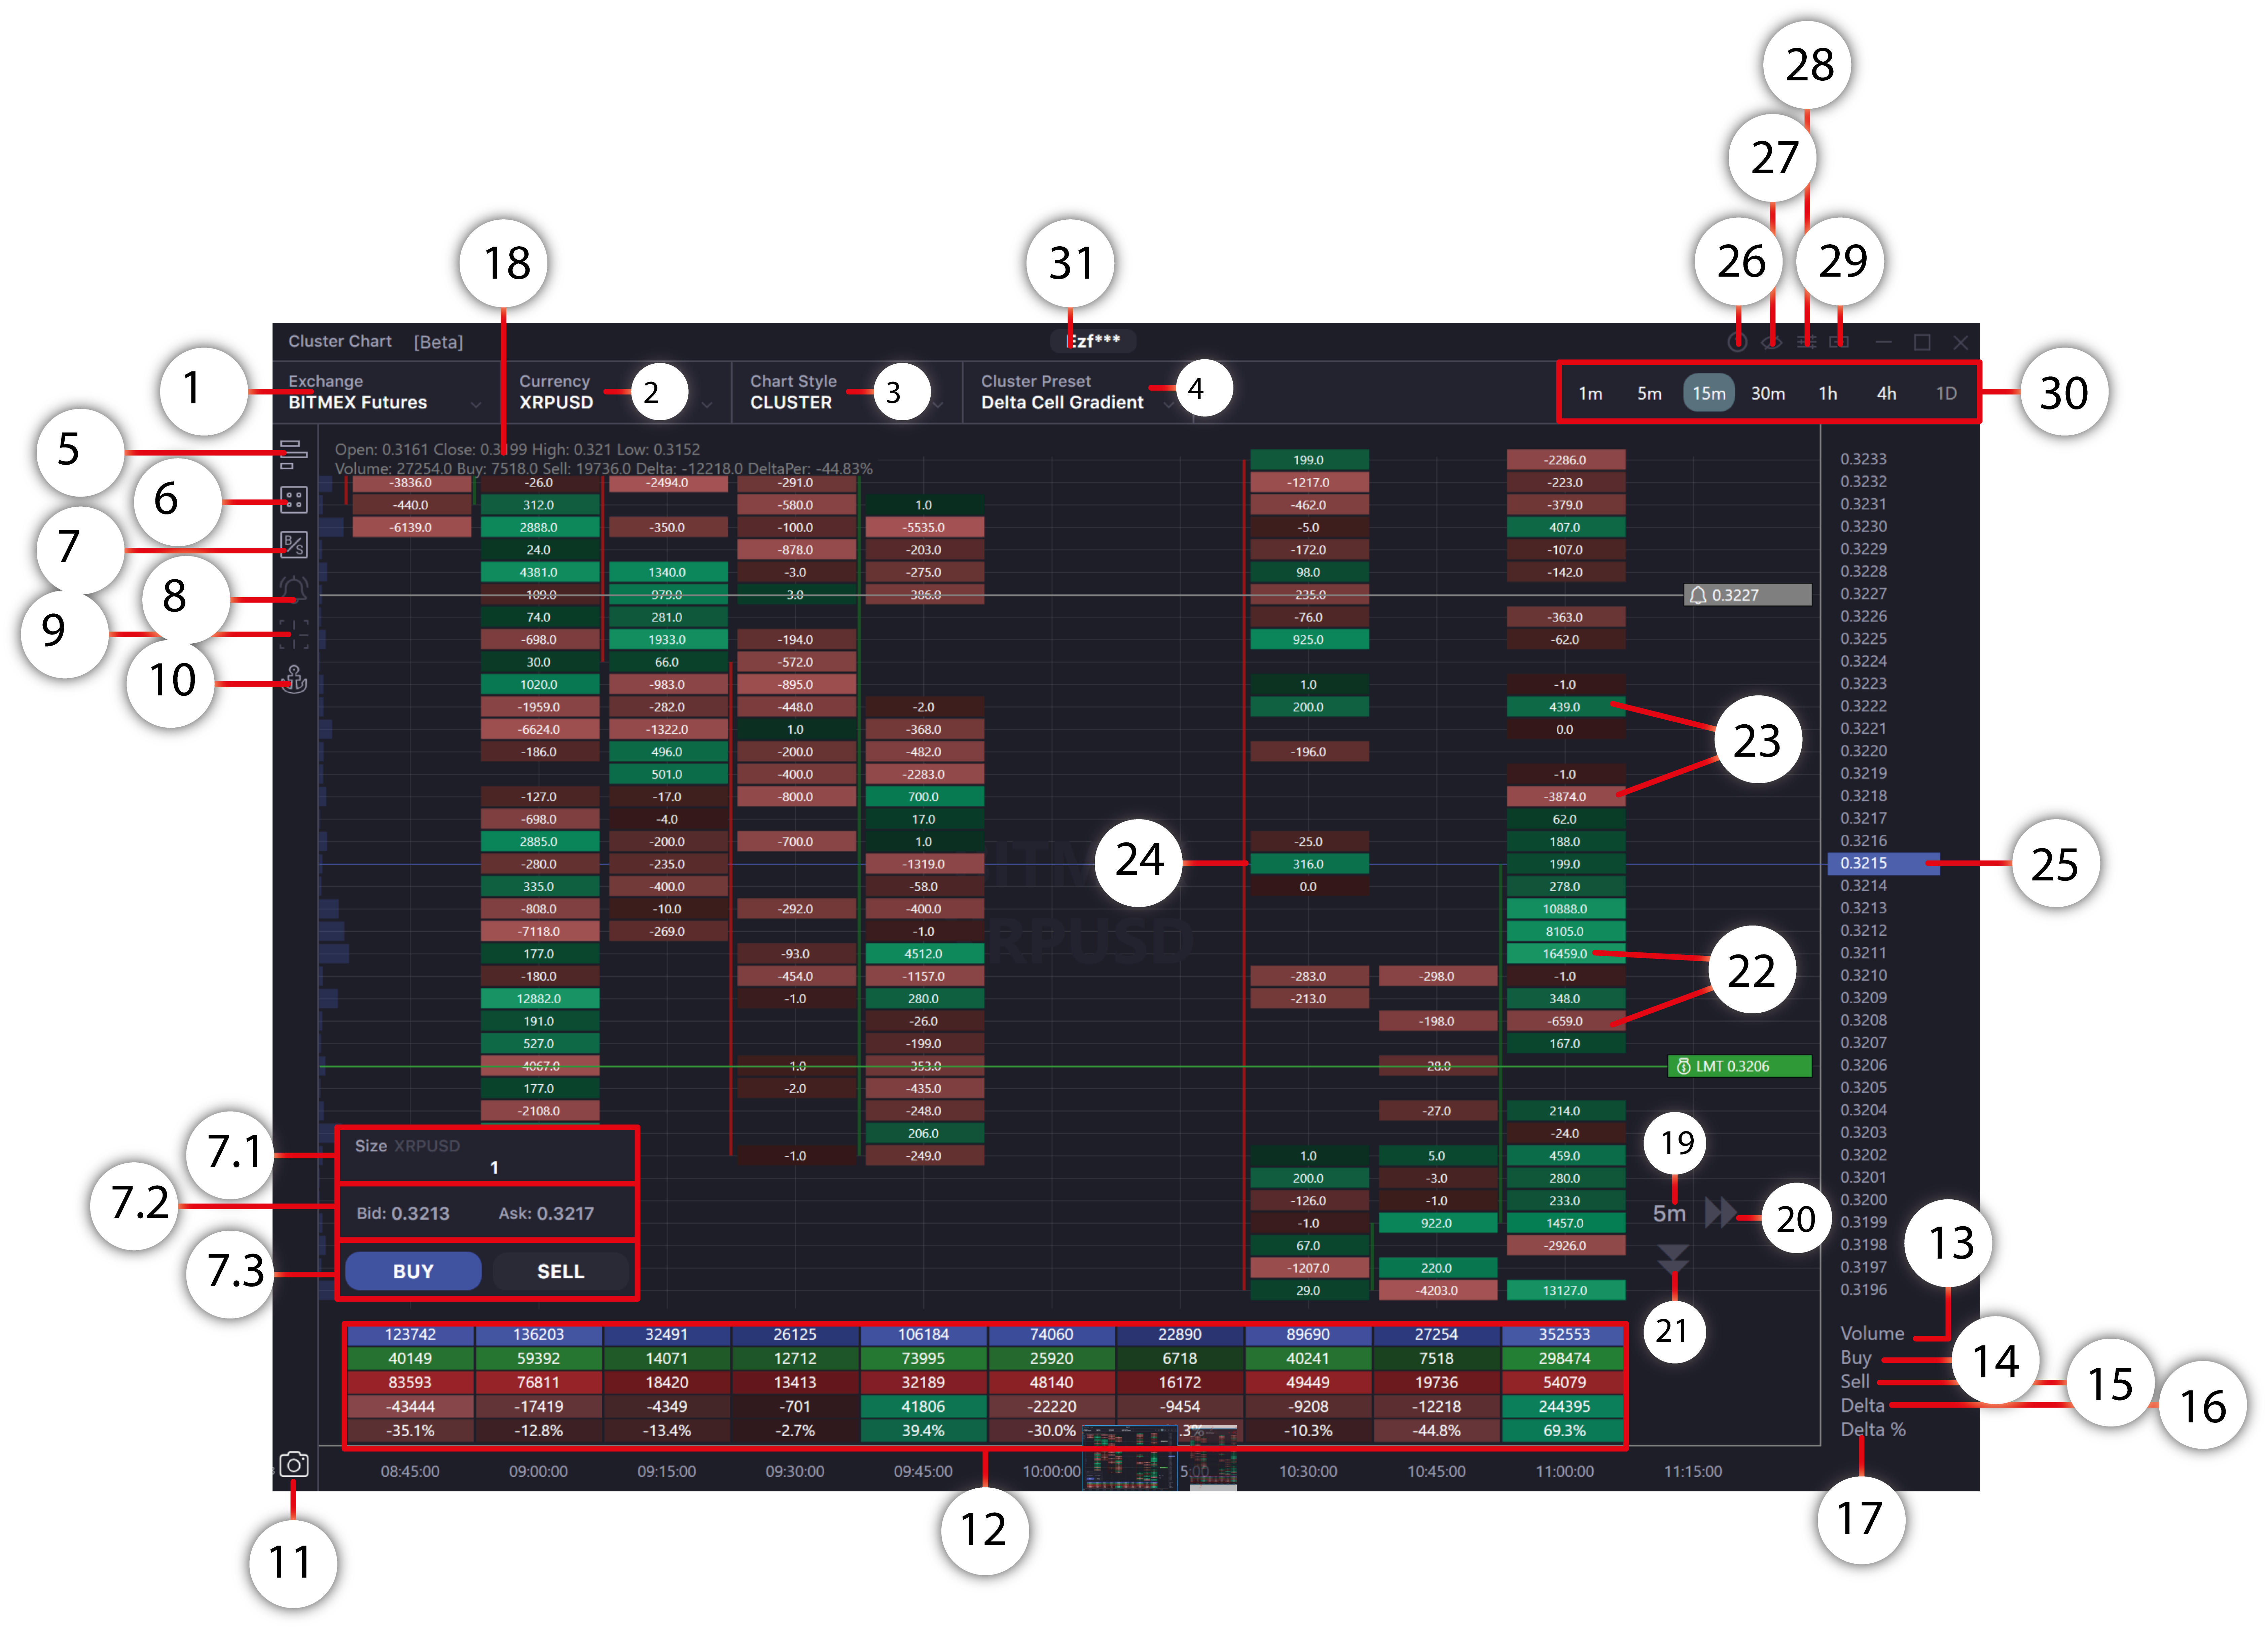
- Exchange selection field.
- Select a trading instrument here.
- A field for selecting the chart style. (Note 1)
- The field for selecting the Cluster Preset. We have formed preset combinations of data reflection and cluster drawing for your convenience. The clusters are built based on: the data of the Trading Volumes, the Buying and Selling Volumes, the Delta of the Difference between the Selling and Buying Volumes, and their combinations. Select the preset that best suits your trading style. (Note 2)
- Button to switch on/off the display of Left Volume profile
- The button to enable/disable the Time Statistics display.
- Activate to bring up a mini window for trading. (sending limit orders, with the option to use a "taker" or "maker" strategy).
- 7.1. Input field for the number of contracts for Contracts.
- 7.2. The current prices for the Best Buy and Best Sell orders.
- 7.3. Buttons for quick trading from the chart (Buy/Long and Sell/Short). When using the Maker Button Strategy, the first button will be Buy/Long. The Limit order will be sent with the Price of the Best Buy order limit (you will add liquidity to the order book, and your order may not execute immediately, but you will save exchange commission). The second button will be Sell/Short, and the Limit order will be sent with the Price of the best Sell order limit (you will add liquidity to the order book). When using the Taker Button Strategy, the first will be a Sell/Short button, and the Limit Order will be sent with the Best Buy Order Limit Price (you will take liquidity from the order book with instant order execution but with a higher exchange commission). The second will be a Buy/Long button, and the Limit Order will be sent with the Best Sell Order Limit Price (you will take liquidity from the order book).
- 7.4. Place a pending order on a selected trading instrument. You can drag the placed order along the price scale by holding down the left mouse button. When you drag an order, the limit price for limit orders changes and the stop price for stop orders (stop limit orders and trigger orders) changes. It is also possible to cancel an order by clicking on it with the right mouse button.
- Activate to display a price alert on the chart. (Click on the icon. Next, on the chart, click opposite the desired price.)
- 8.1. Place a price alert for the selected trading instrument. You can place a price alert directly on the heat map by clicking on the button on the left panel of the window. You can also drag and drop the price alert on the price scale by holding the cursor with the left mouse button. Or you can cancel the price alert by clicking on it with the left mouse button.
- Click on the icon to activate the Cross on the chart (in the settings, you can change the crosshair style to "horizontal line only" or "vertical line only").
- Activate to "anchor" the best buy and sell order price lines in the visible area of the chart. When the button is enabled, the order book activity chart is drawing in the visible zone. If prices move outside the visible area, the chart automatically aligned according to the center of the price scale.
- Button to screenshot the chart. By clicking on the button, a screenshot of the chart appears on the clipboard. Now you can share the screenshot or save it for further analysis.
- Time Statistic block. Here you can see the summary information on volumes for each timeframe.
- The block with cells displays the total trading volume of the selected instrument over a time frame.
- The block with cells displaying the market buy volume ( ASK trades) of the selected instrument over a time frame.
- The block with the cells displays the market sell volume ( BID trades) for the selected instrument over a time frame.
- The block with cells displays the delta of the difference between buys ( ASK trades) and sells ( BID trades) for the selected instrument for the time frame. If the value is negative and the cell is colored red, then sell prevailed over the buys. Buys prevail over the sells if the value is positive and the cell is colored green.
- The block with cells displaying the percentage ratio of the delta from the total trading volume of the selected instrument over the time frame. Delta % = Delta / Total trading volume * 100 for a time period.
- Point your cursor at any time interval on a chart, and in this block, you will see general information about the candle and the time statistics for that time interval.
- A timer that shows the remaining time until the next time frame on the chart begins. If, for example, you turn on the one-minute chart for viewing, the timer will show how many seconds are left before drawing a new one-minute interval.
- Reset zoom button to the standard position at the horizontal time scale (X-axis)
- Reset zoom button to the standard position at the vertical price scale (Y-axis)
- Quantitative display of cluster data for the selected price of a particular timeframe. For different types of the Cluster chart, this may be the value of total trading volume, trading volume of sales and buys, or delta of the difference between sales and buys.
- A chart displays the cluster data for the selected price of a particular timeframe. For different types of Cluster charts, it may be a painted histogram part, a colored cell, or a cell with internal color separation.
- The Candle of the price chart of the selected timeframe
- The line showing the price of the last trade of the selected asset
- The Info button allows you to choose and watch a video or PDF manual for Cluster Chart.
- This button activates "always on top" mode.
- Button for advanced settings of the Cluster Chart window.
- Link the Cluster Chart window to other terminal windows. You can change the linking group by сlicking again on the button, or you can leave the button in the neutral position, and the window will not be associated with any linking group.
- Choose a timeframe for the chart.
- The button to open the API Management window, to manage exchange API keys, and use the Multi Api functionality. (Note 3)