#
Note 2. Cluster Preset
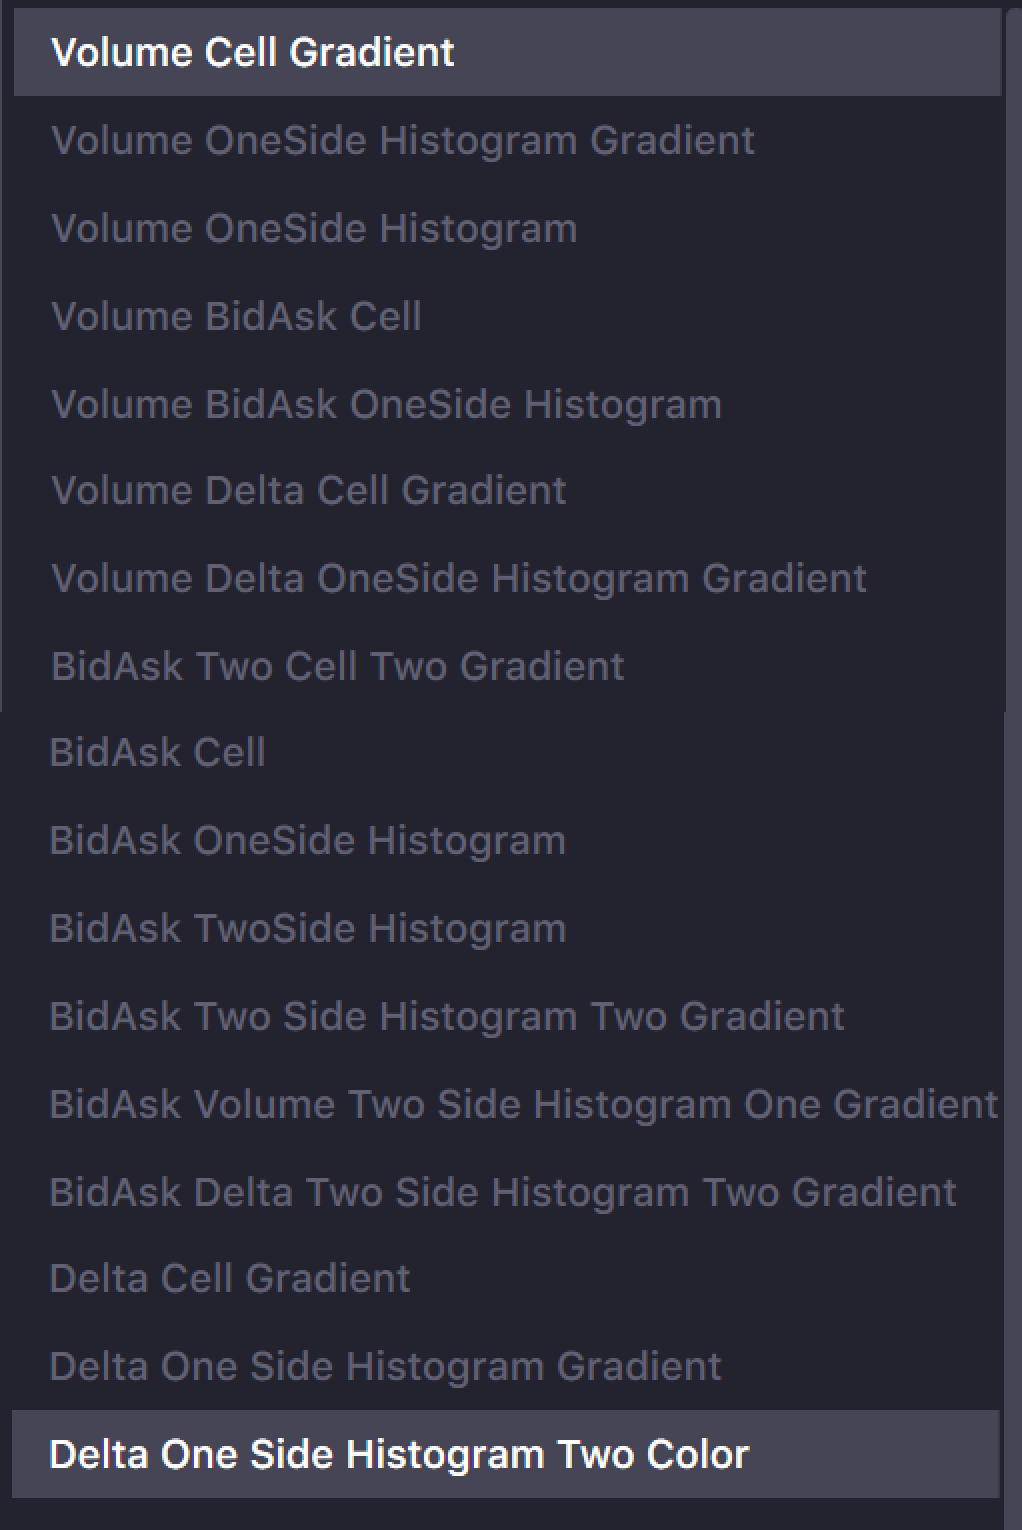
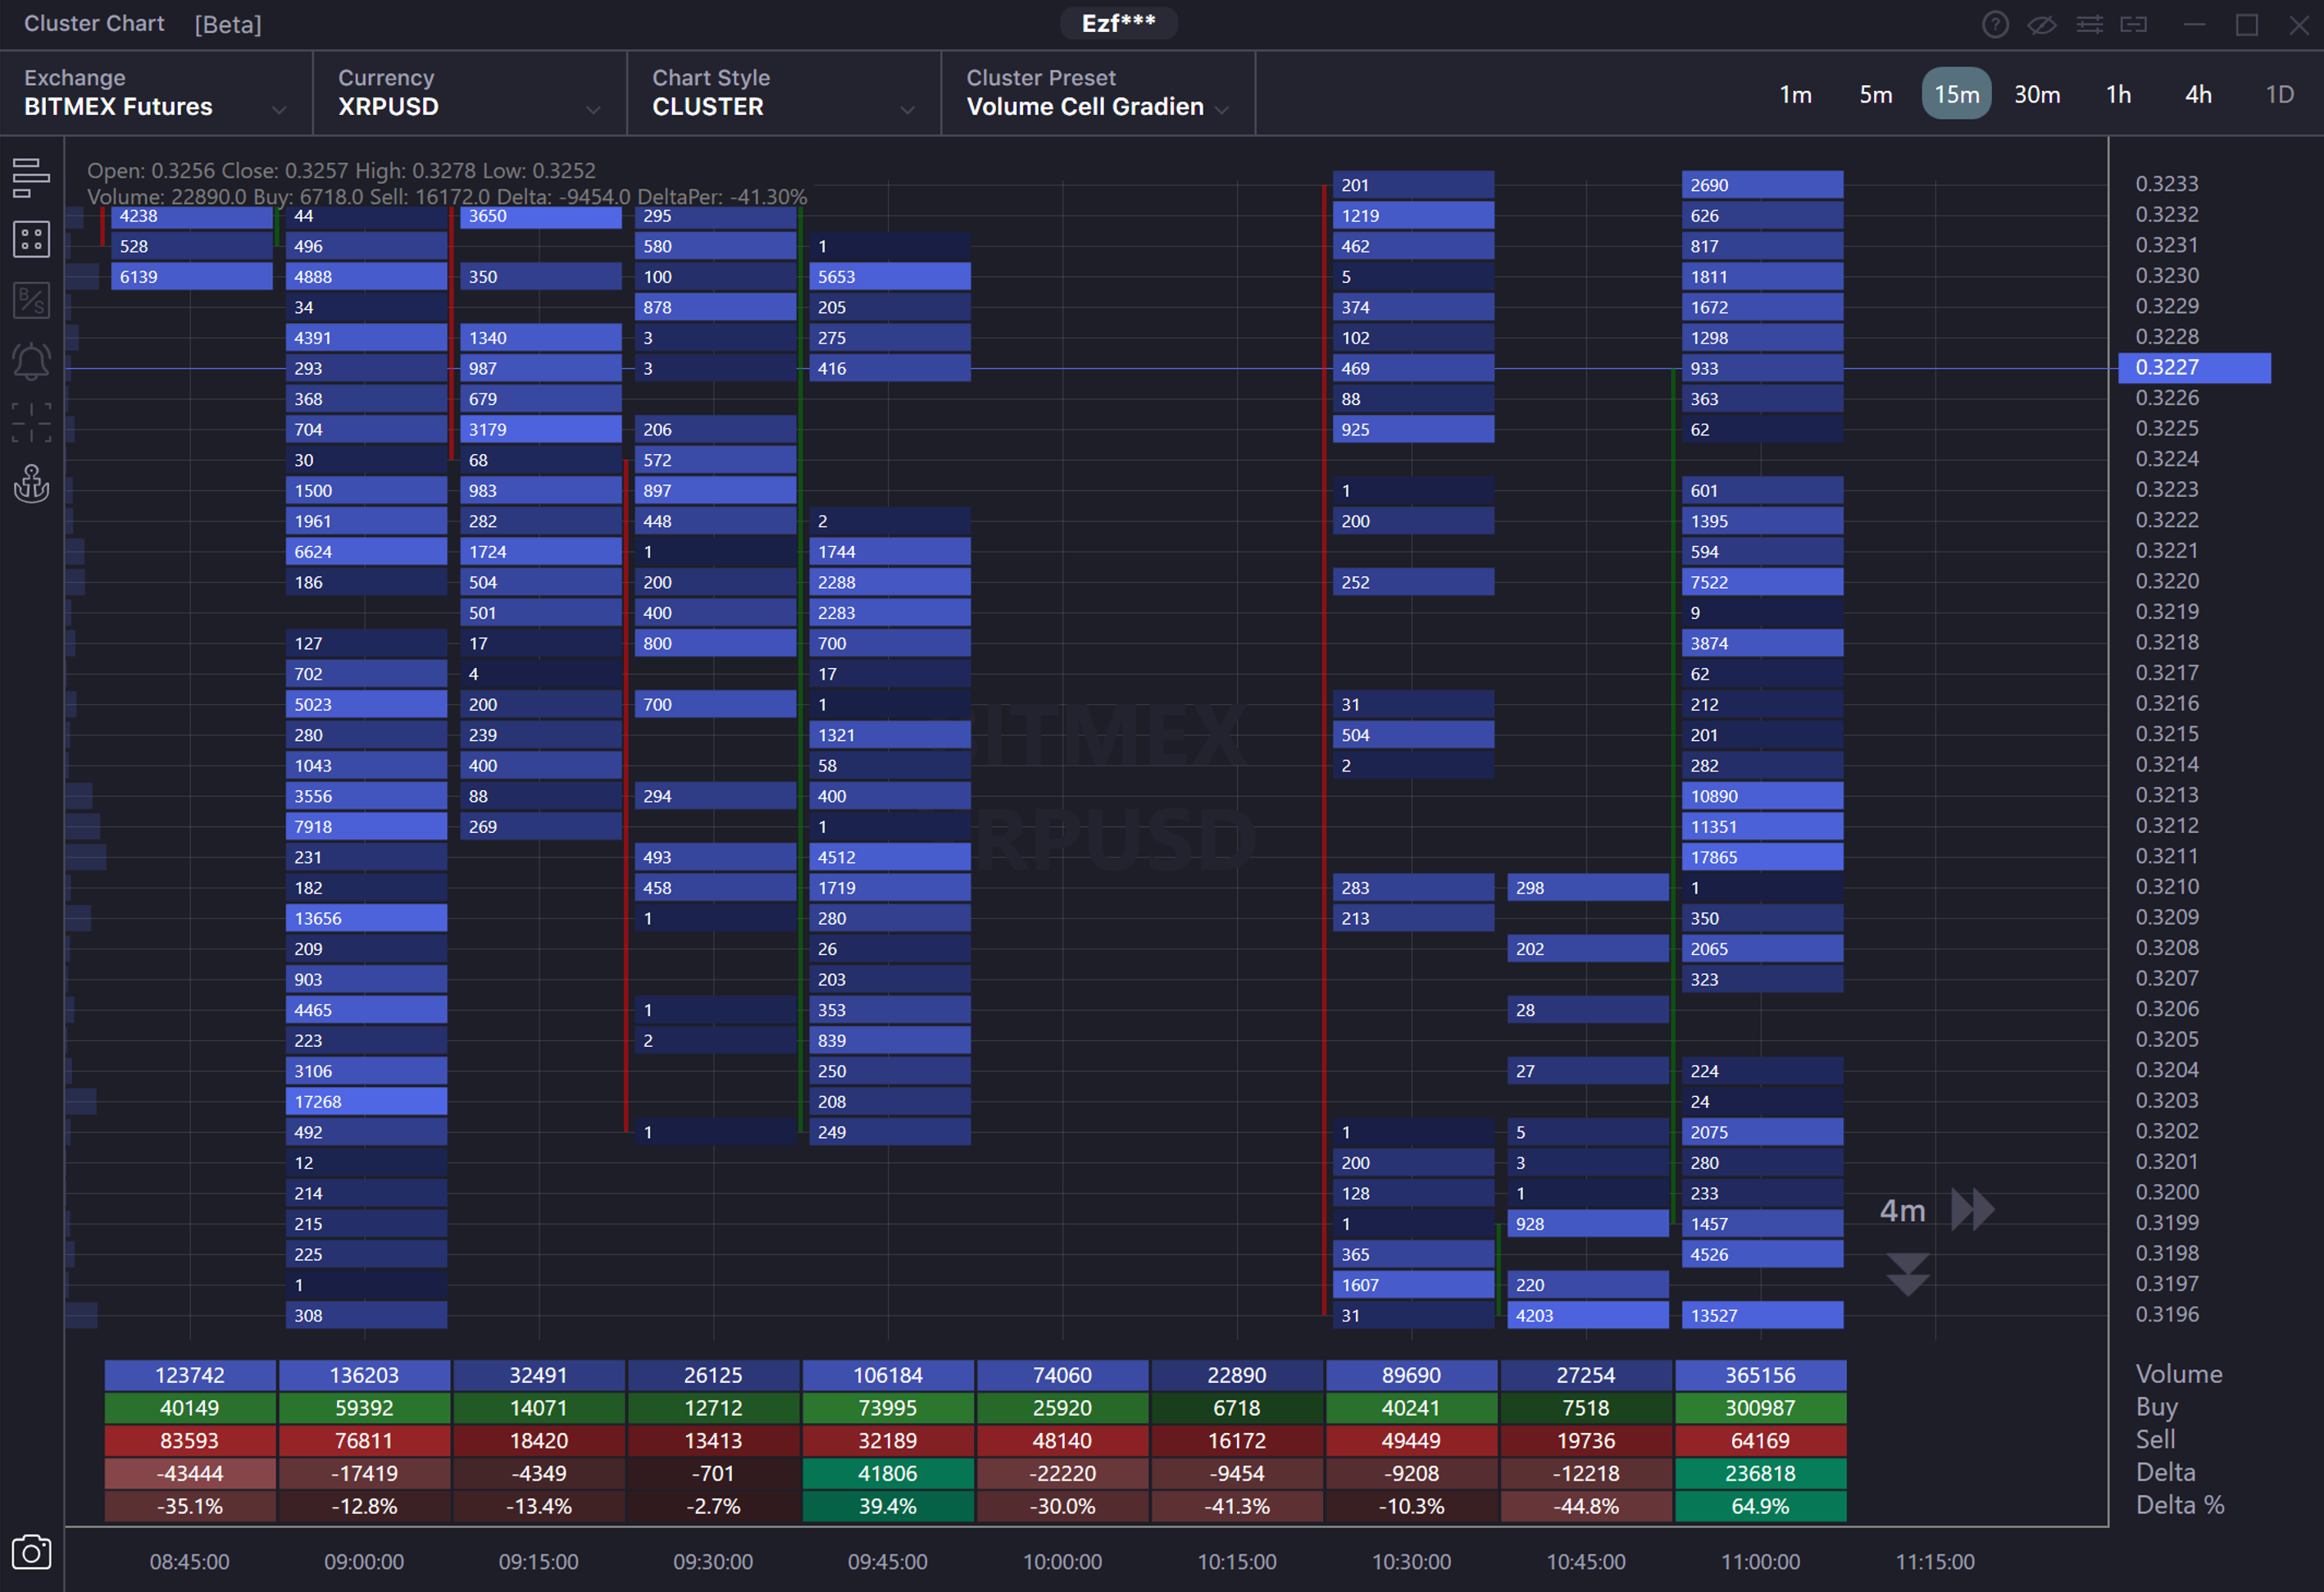
Volume Cell Gradient - The cluster chart shows the traded volume by price over a time frame. The data is displayed in cells with different levels of transparency and brightness. The maximum volume displays in the brightest and most saturated cell. Cells with minimal volume will be dim and transparent.
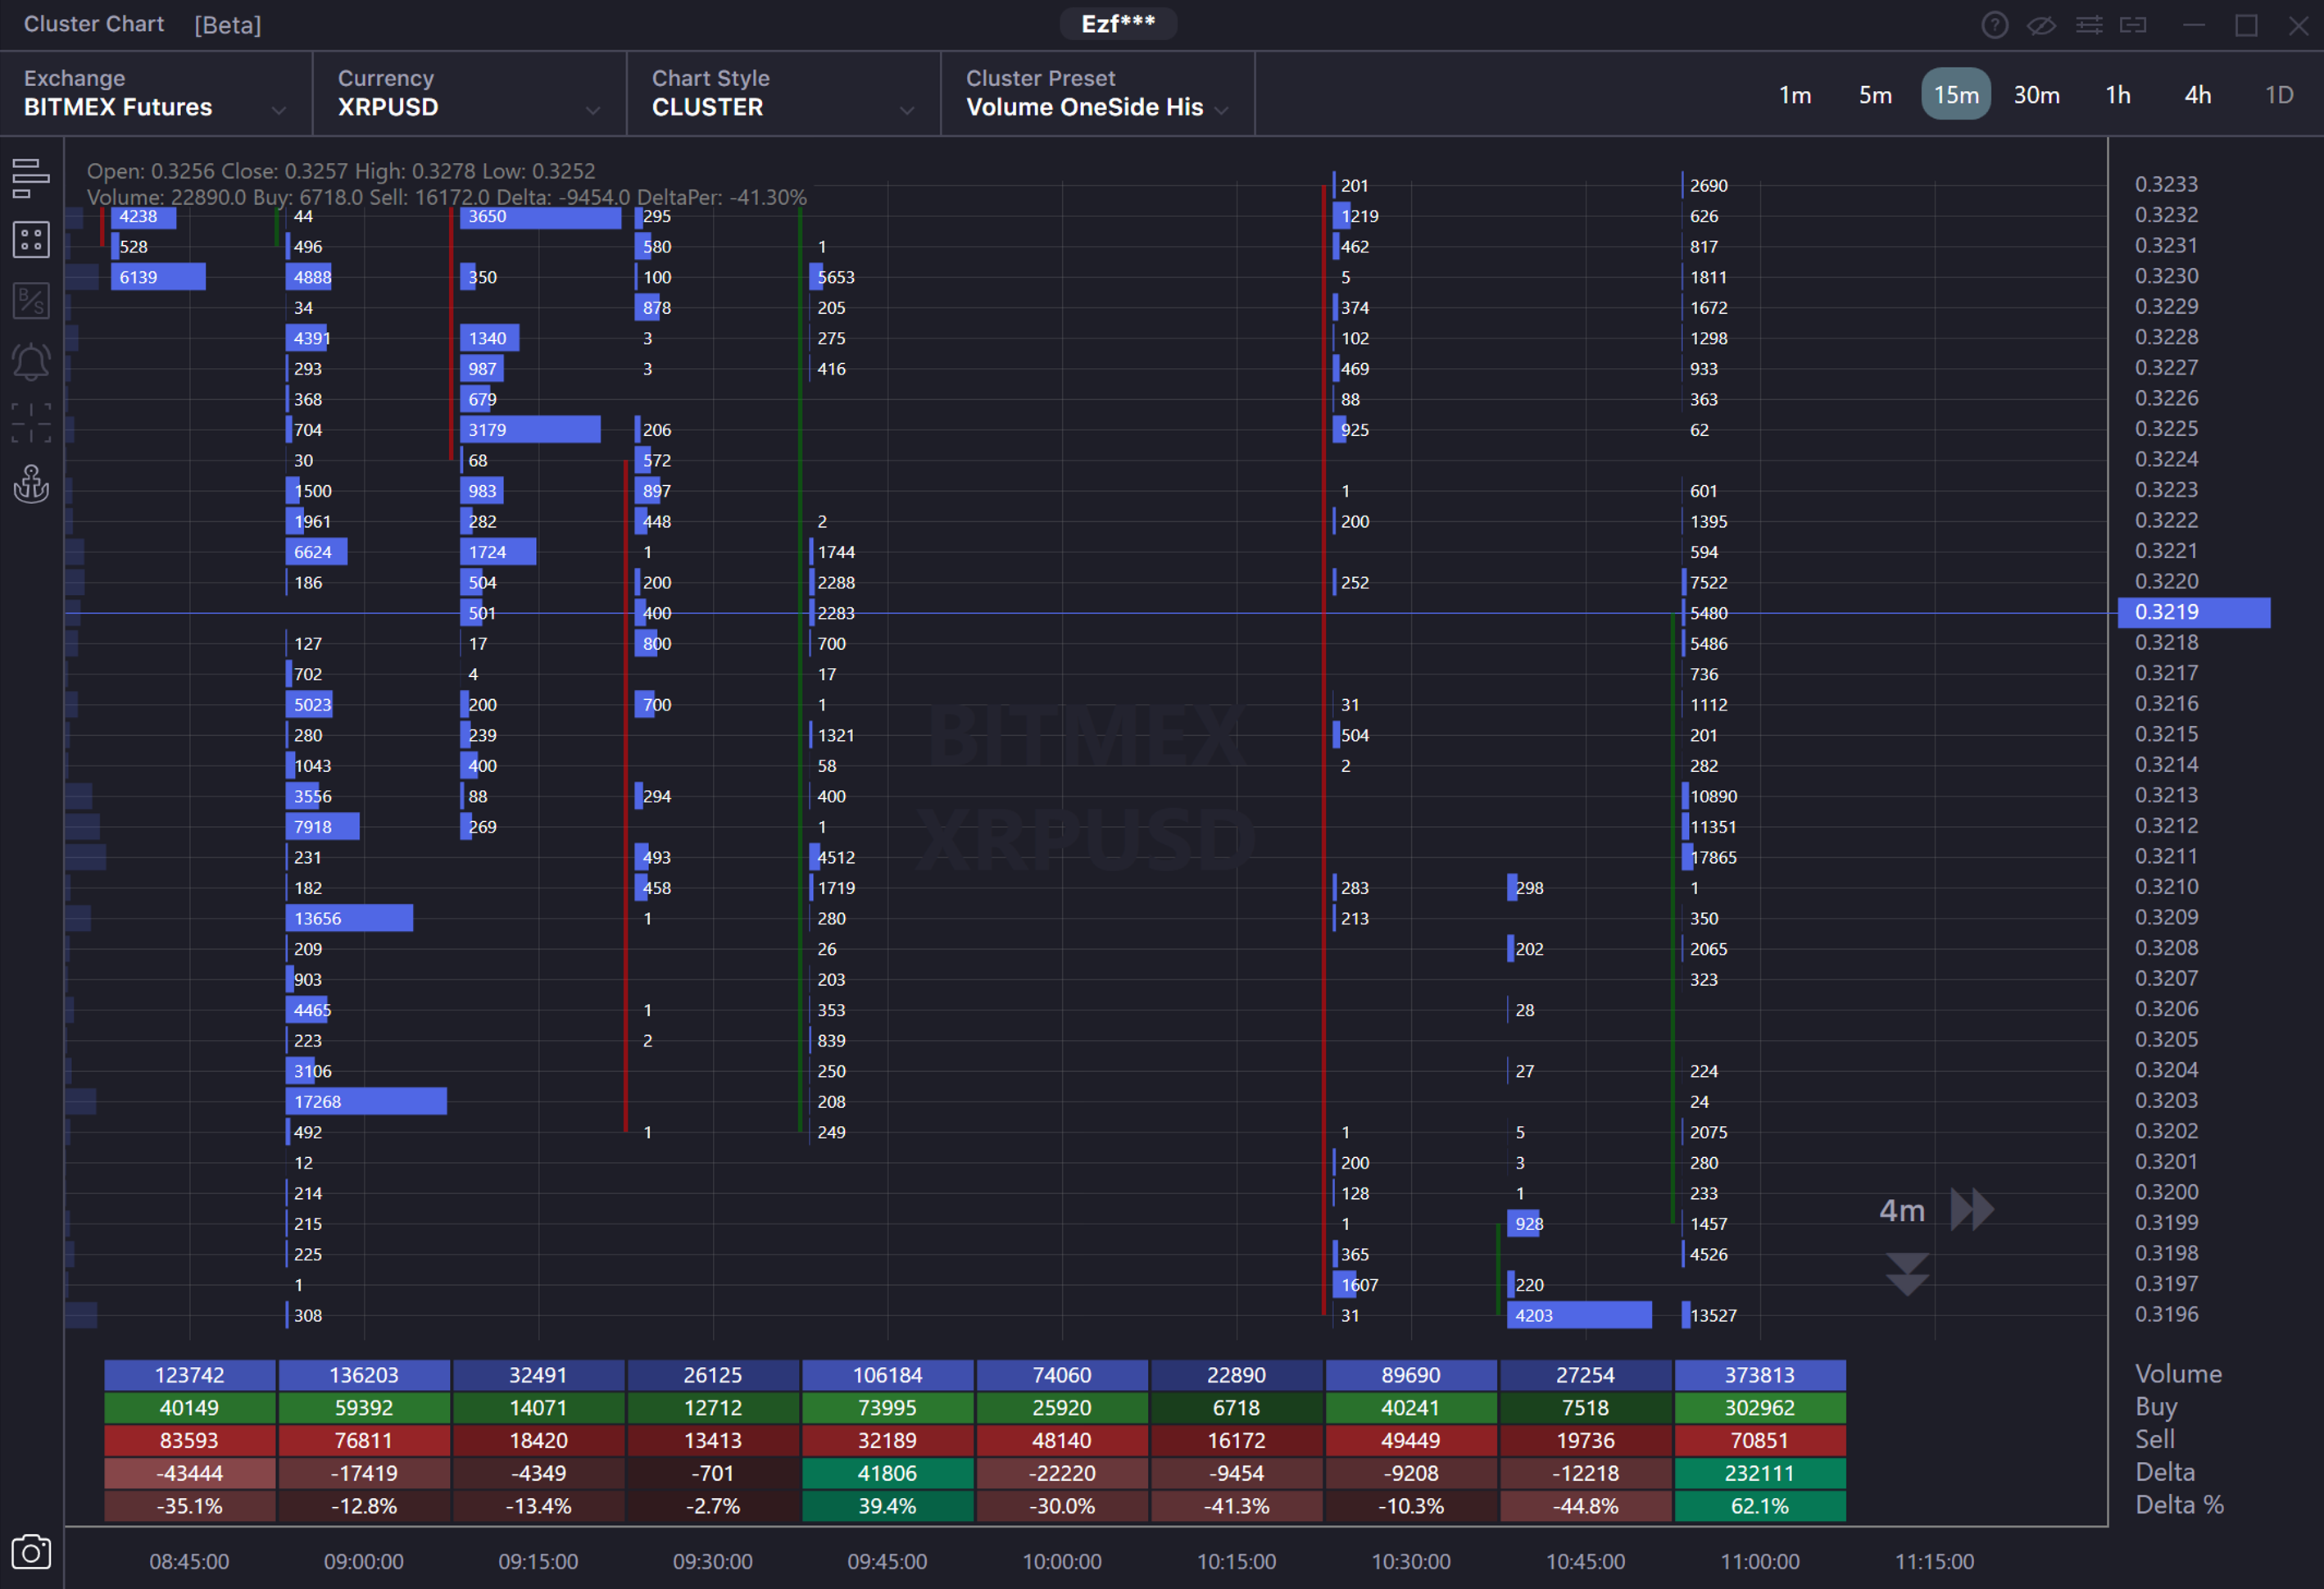
Volume one side Histogram Gradient - The cluster shows the traded volume by price over a time frame. The data is shown in one-side histograms with different levels of length, transparency, and brightness. The longest and the brightest histogram will display the max volume. Short histograms with minimal volume will be dim and transparent.
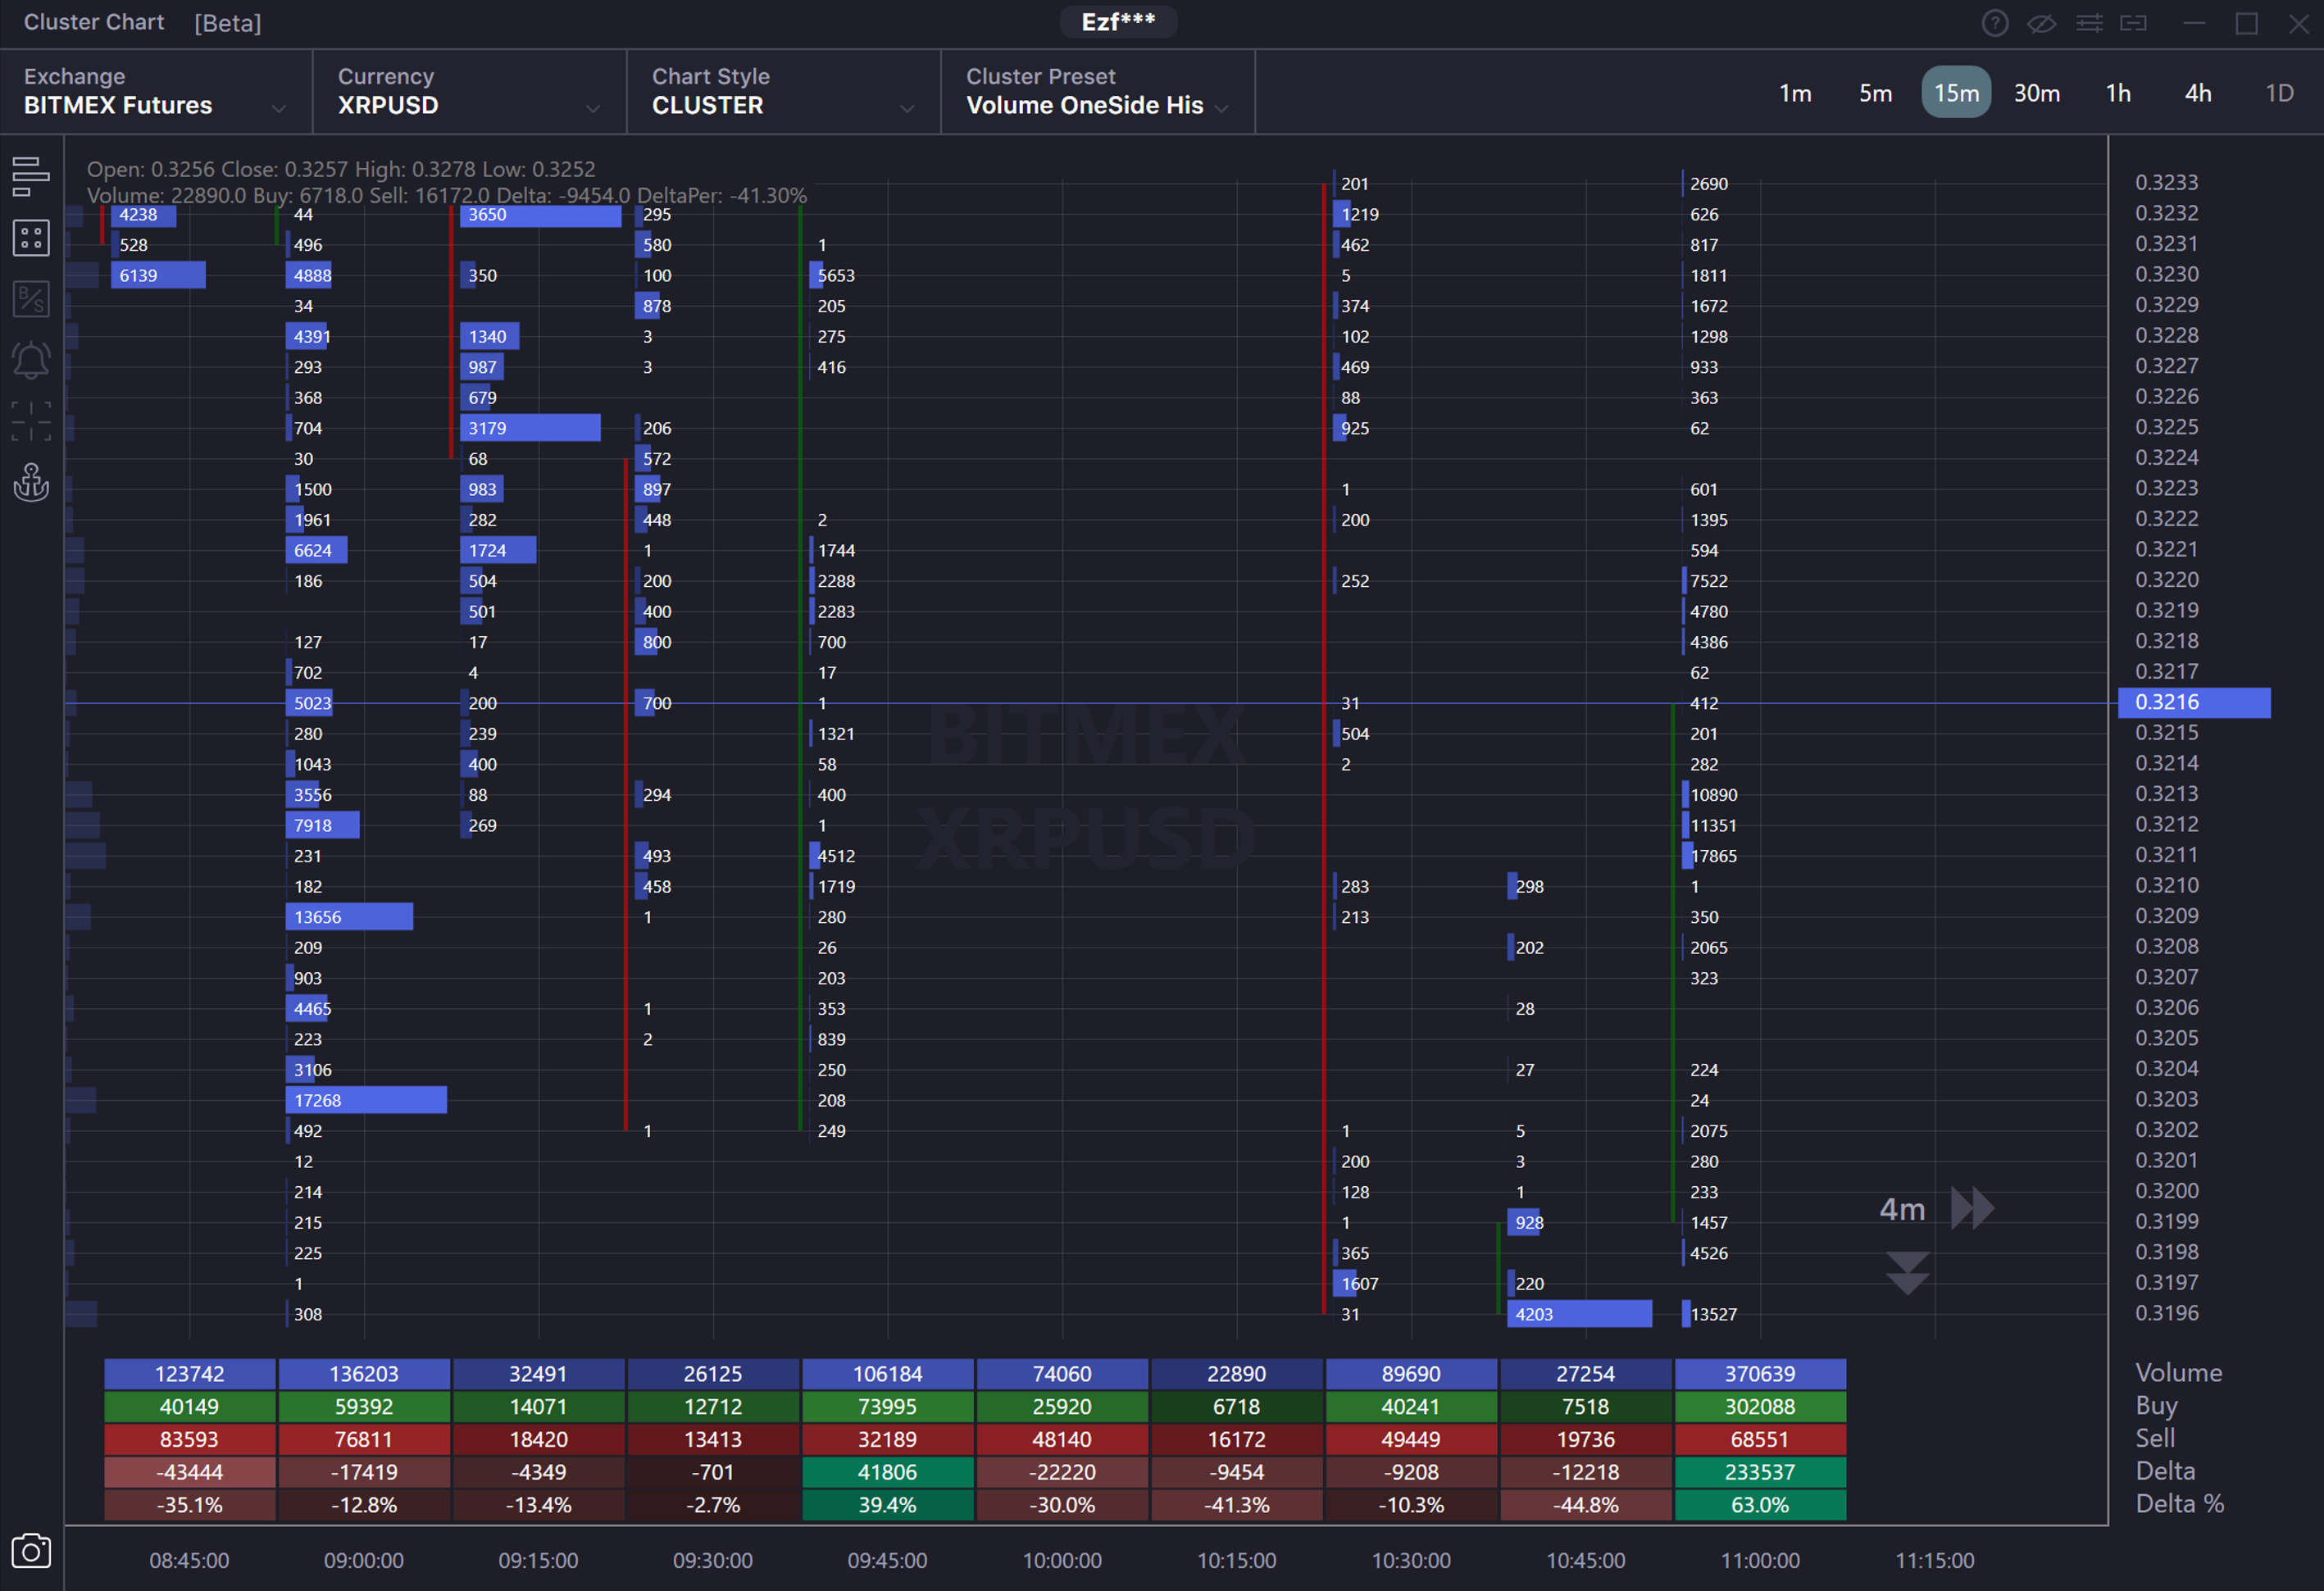
Volume one side Histogram - The cluster shows the traded volume by price over the time frame. The data is shown in one-side histograms with different length levels. The maximum volume is displayed in the longest histogram. The shortest histograms are the ones with the minimum volume.
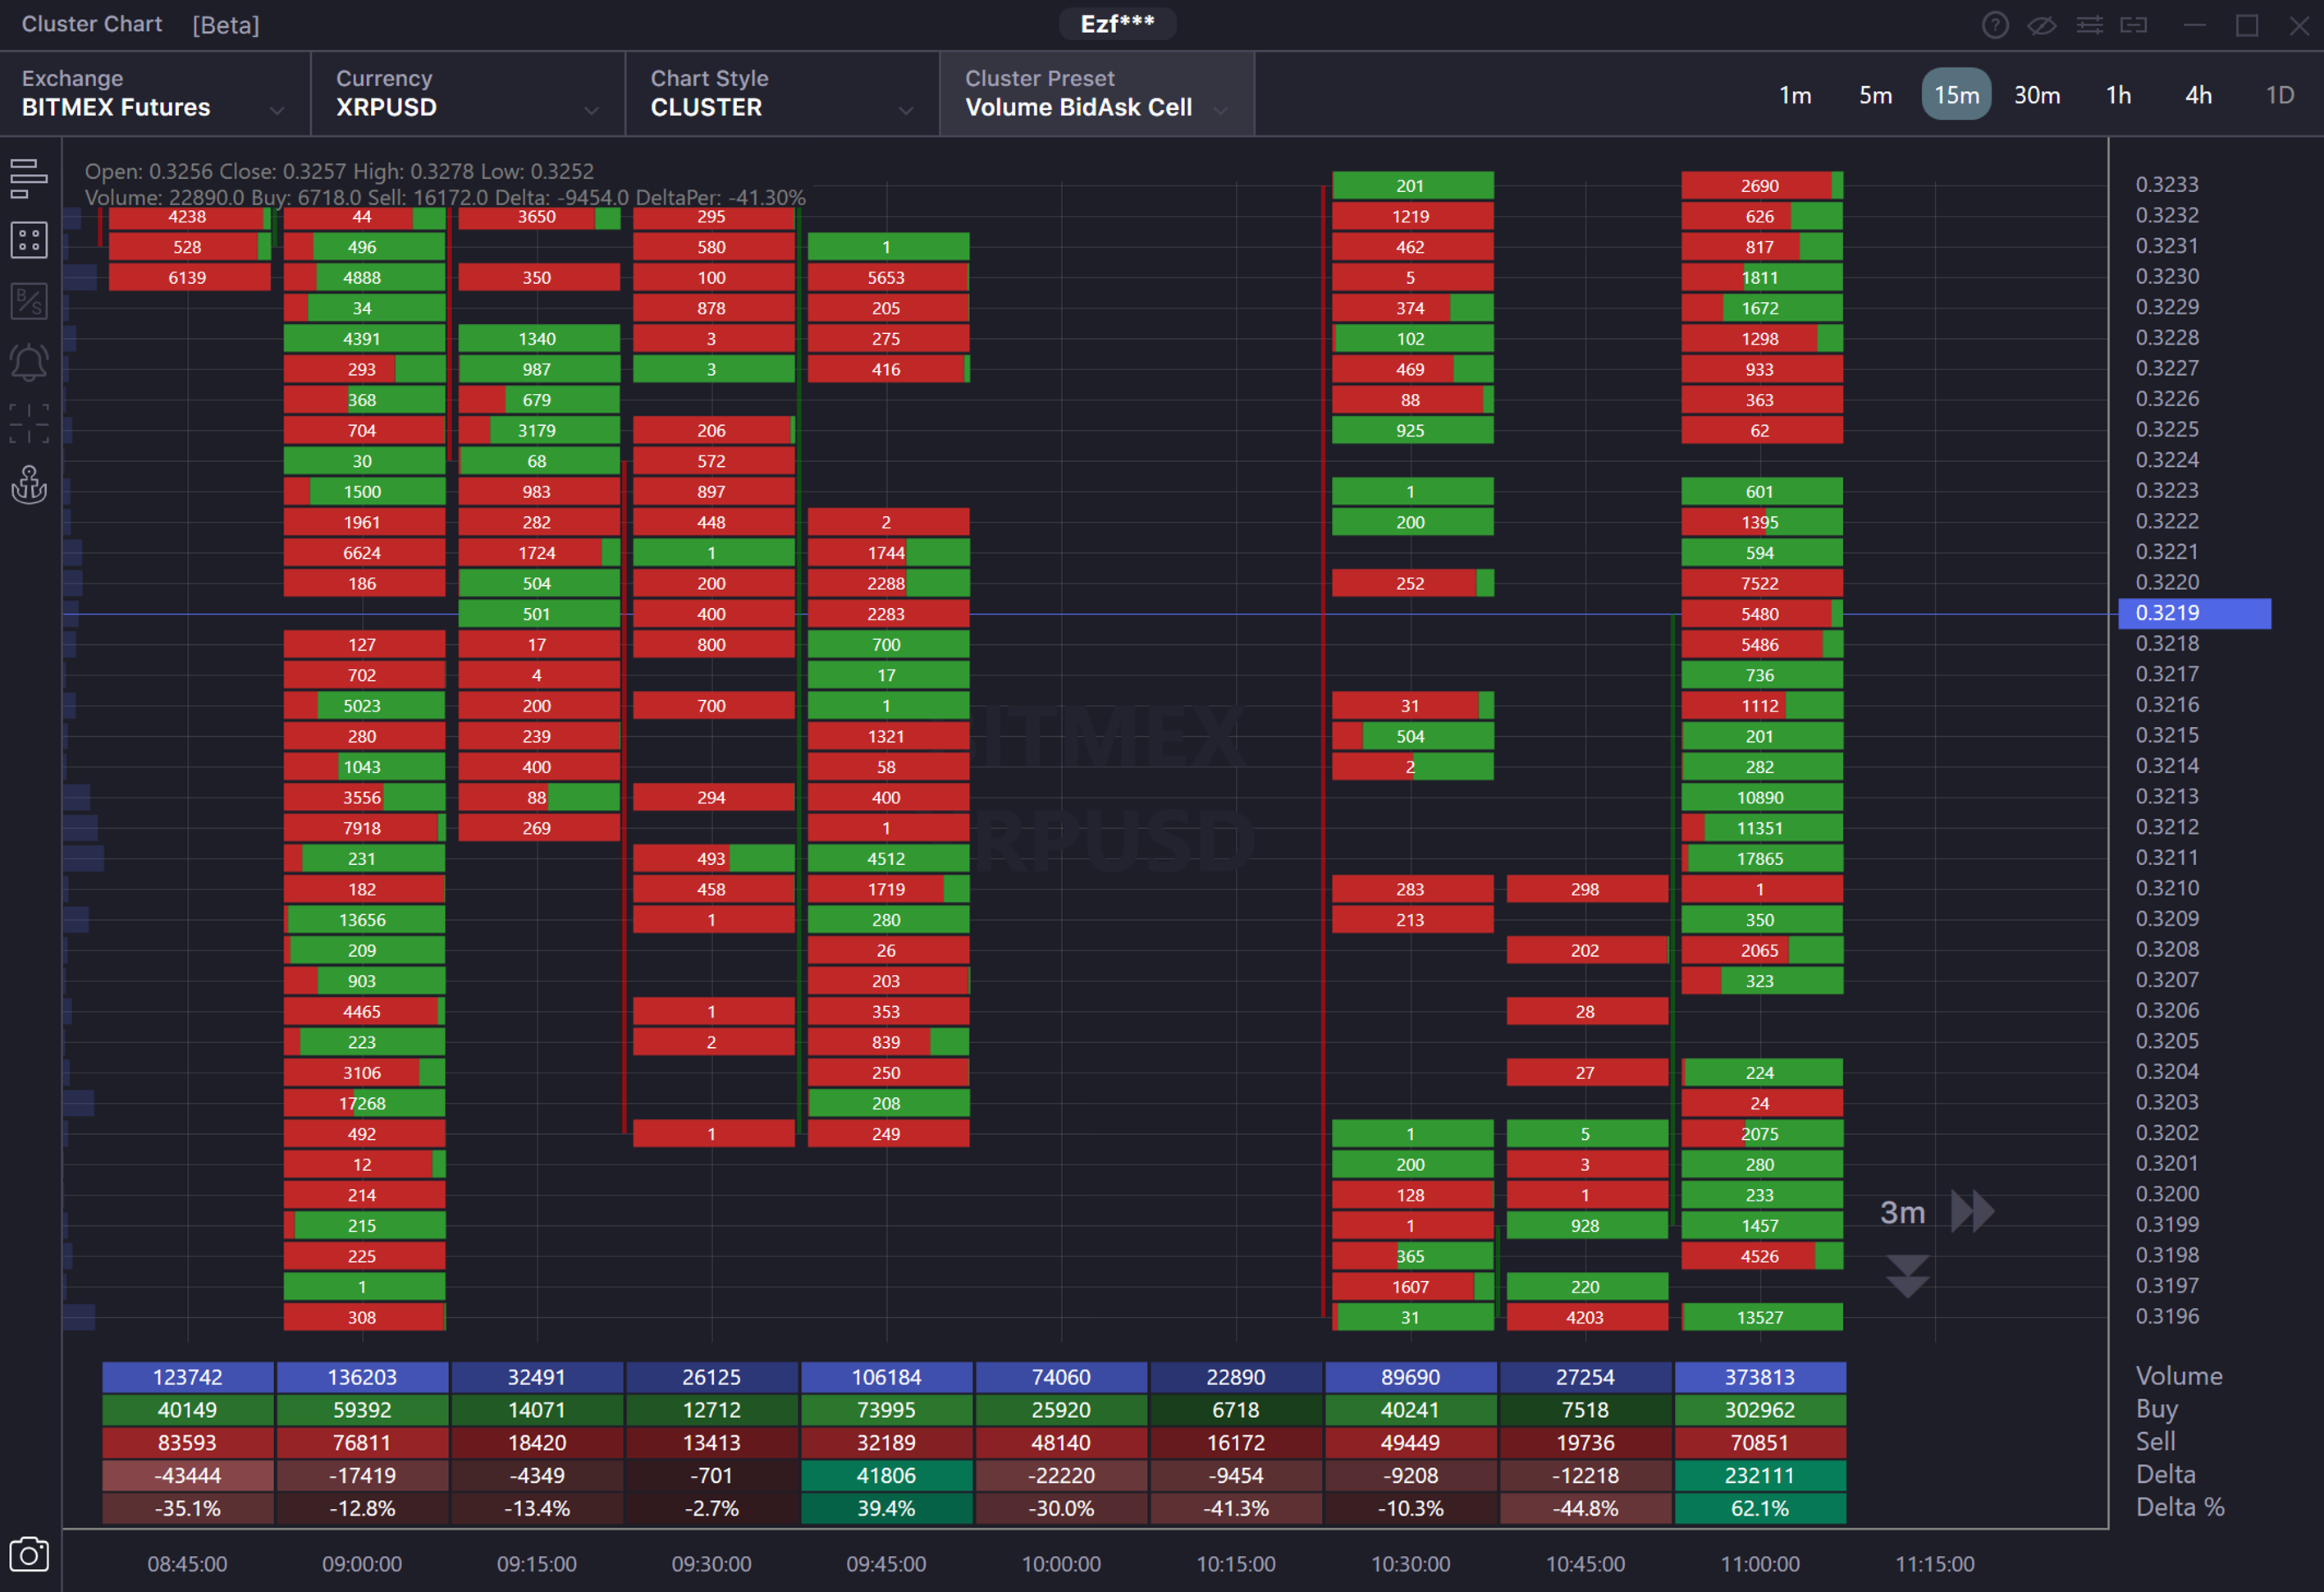
Volume Bid Ask Cell - The cluster shows the traded volume by price over a time frame. The data is shown in cells divided into two parts and colored in two colors. The size of each part depends on the ratio of selling and buying volume at that price. The left side of the cell is colored red and displays trades in Bid (sales), the right side is colored green and displays trades in Ask (buys). A cell with a significant predominance of Bids (sale) will be almost red. If buys prevail, then the cell will be mostly colored green.
Volume BidAsk one side Histogram – The cluster shows the traded volume by price over a time frame. The data is shown in one-side histograms with different length levels divided into two parts and colored in two colors. The length of the histogram depends on the total volume traded at the selected price for the period. The longest histogram will have the maximum traded volume (sum of buys and sells), the shortest histogram will have the minimum volume. The division of the histogram into two parts depends on the ratio of sales and buys at that price. The left part of the histogram is colored red and displays trades in Bid (sales). The right part is colored green and displays trades in Ask ( buy). The histogram with a significant prevalence of sales will be colored in red. If buys dominate, the most part of the histogram will be green. 
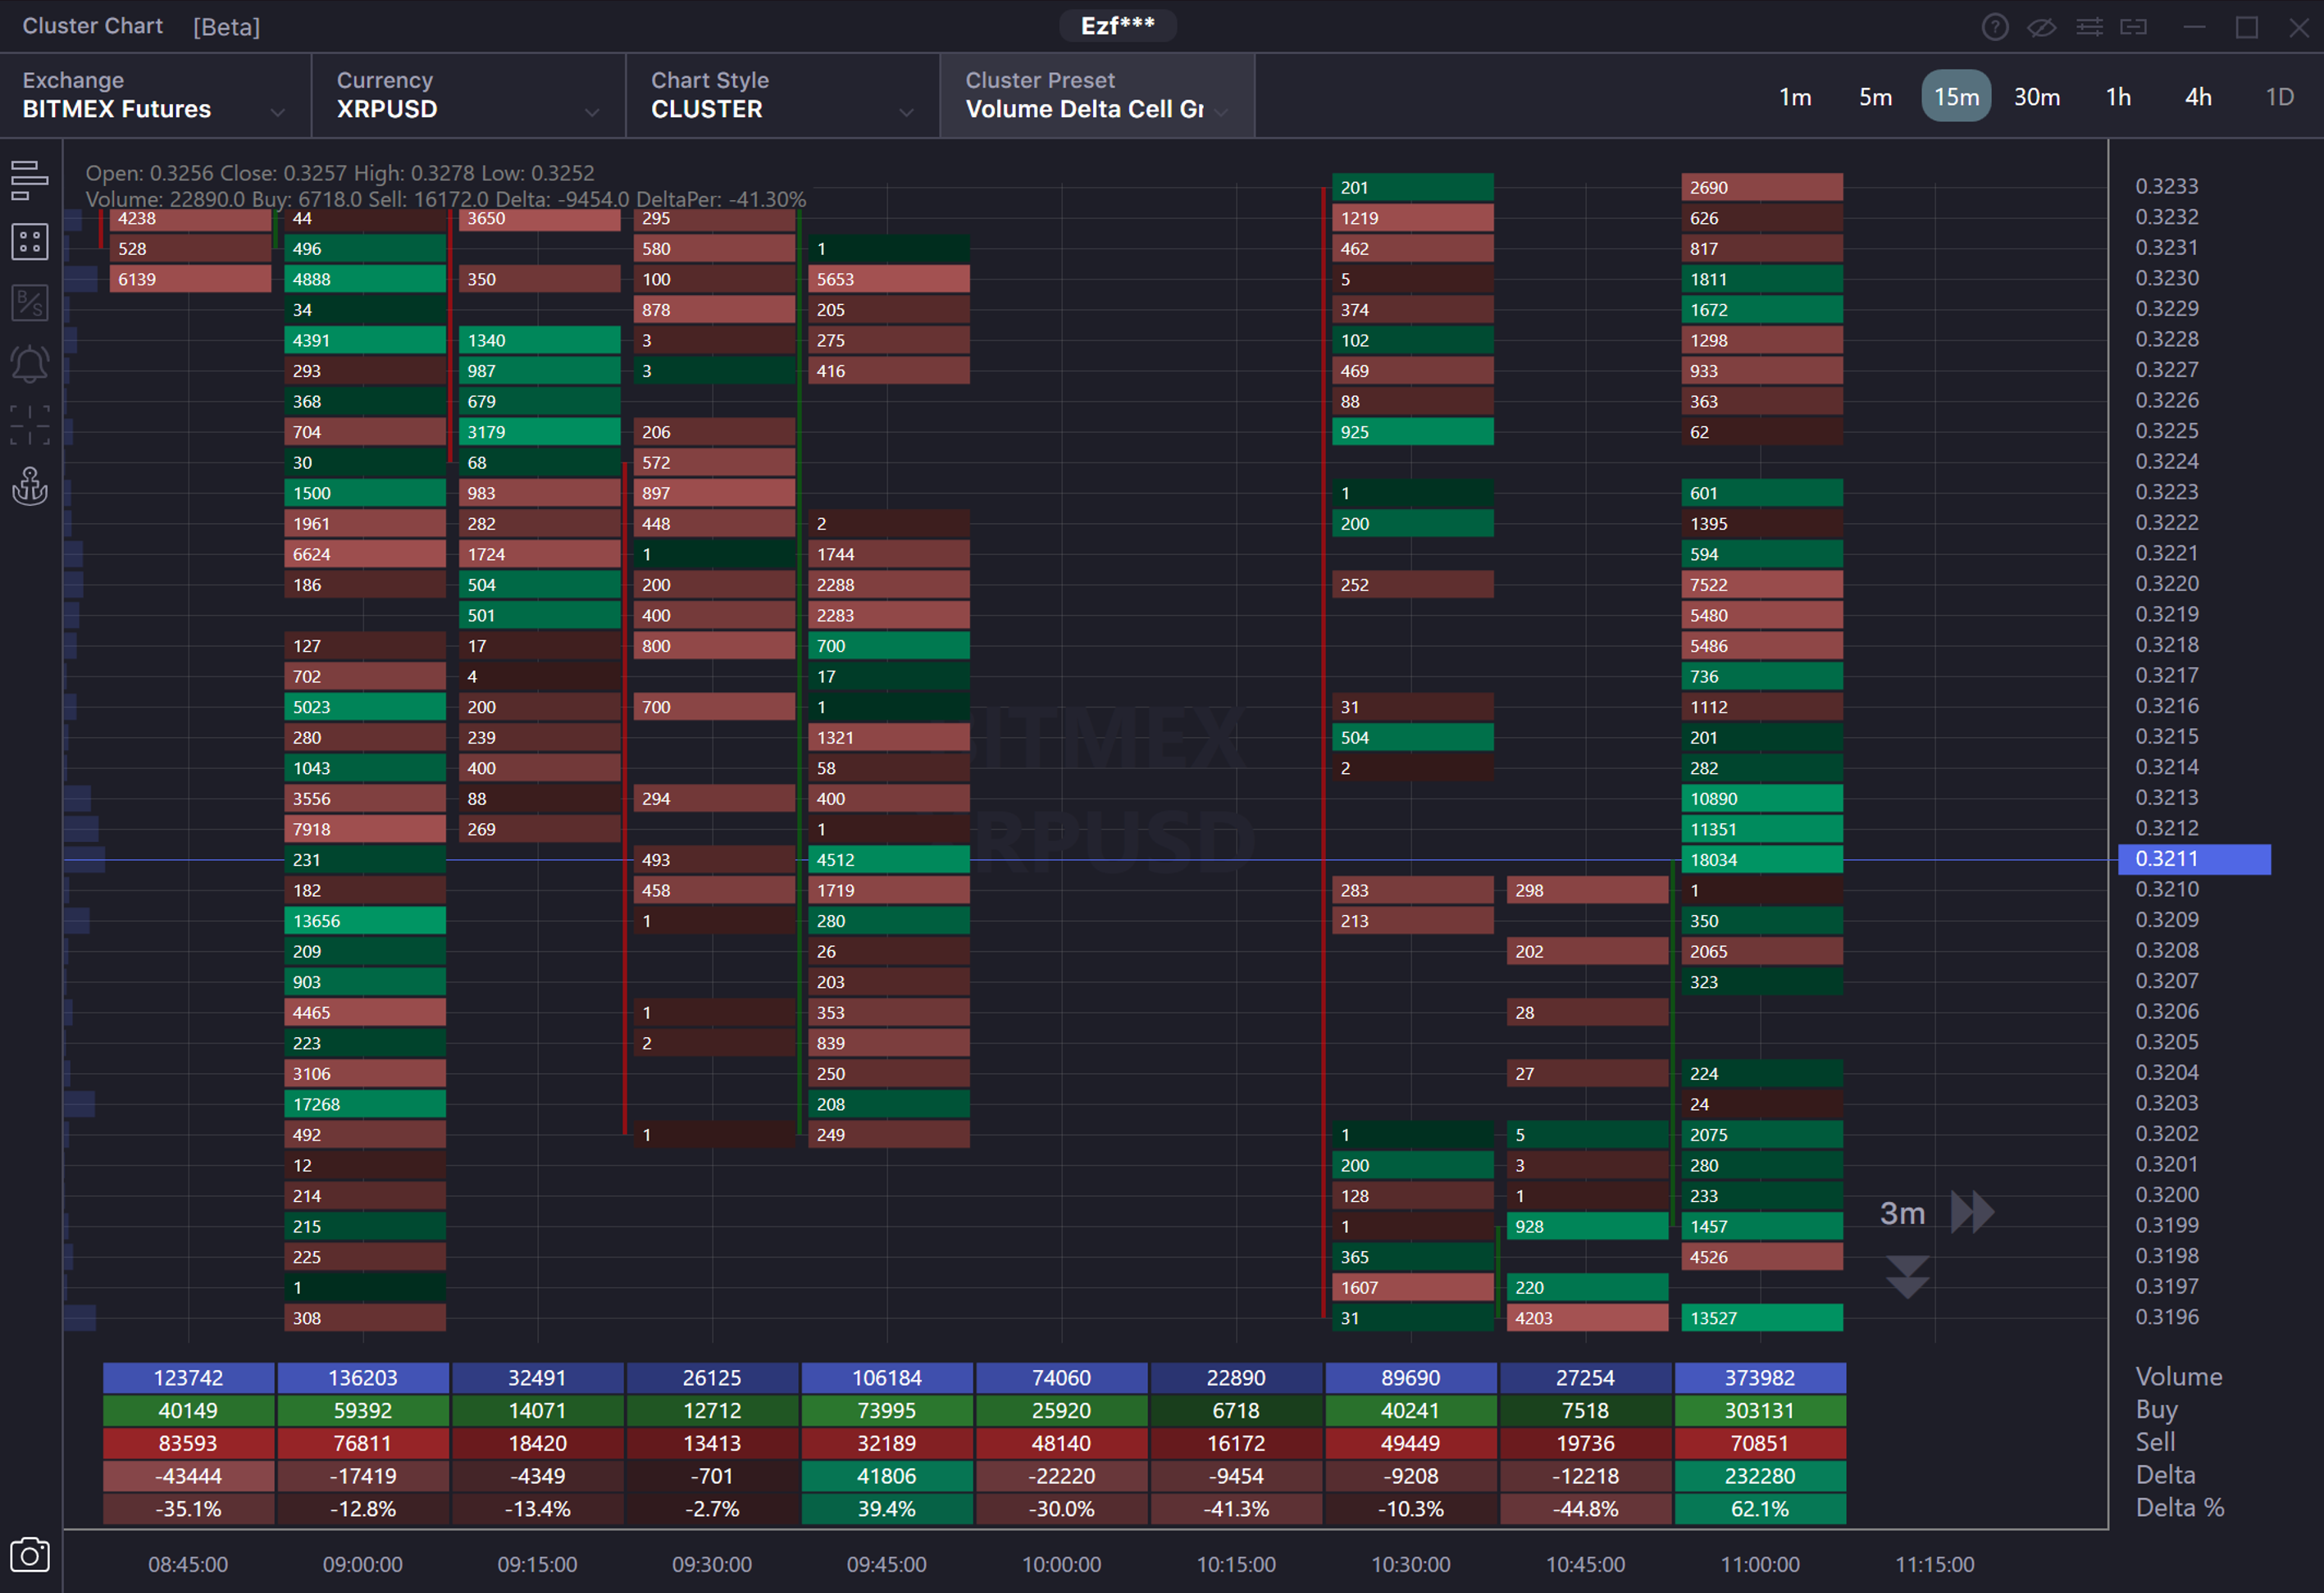
Volume Delta Cell Gradient - The cluster shows the traded volume by price over a time frame. The data is displayed in cells colored in different colors, with various levels of brightness and transparency. Cells with a prevalence of selling orders (negative delta) will have a red shade. Cells with a majority of buying orders (positive delta) will have a green shade. The cell with the maximum value of positive and negative delta will be the brightest and non-transparent over a time frame.
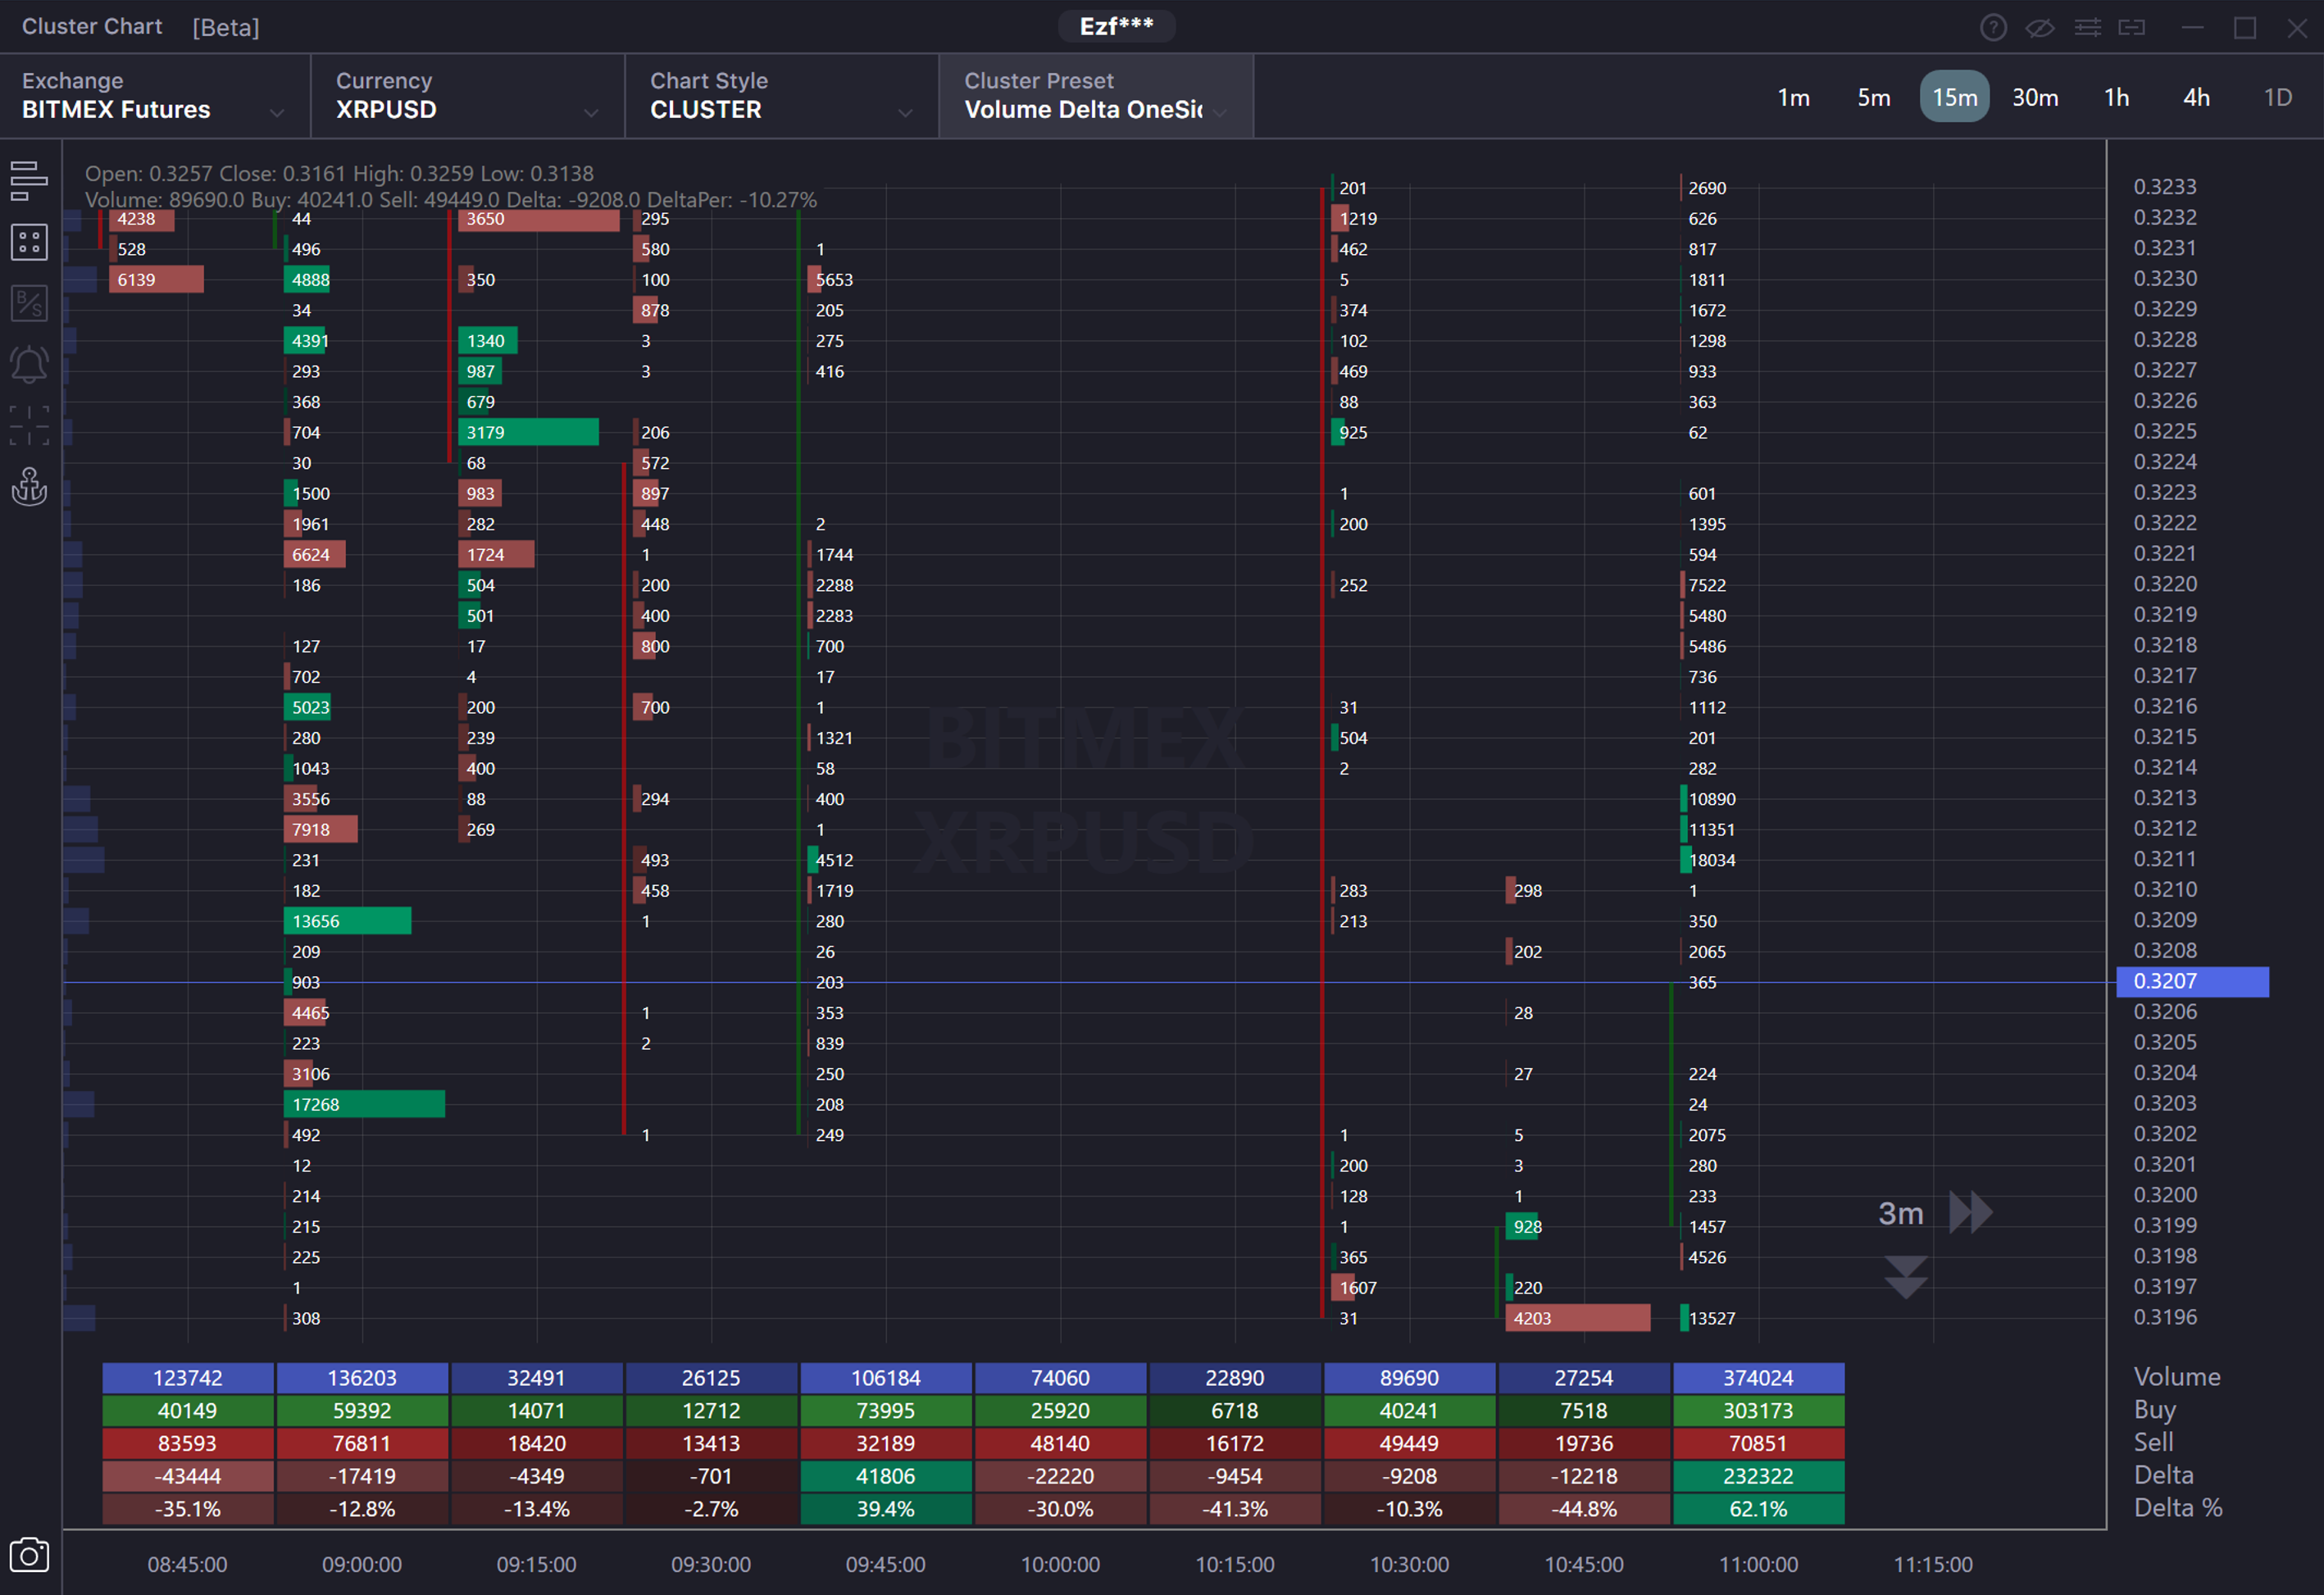
Volume Delta oneside Histogram Gradient - The cluster displayed the traded volume by price over a time frame. The data is shown in histograms of different lengths, colored in different colors, with various levels of brightness and transparency. Histograms with the prevalence of sales (negative delta) have a red shade. Histograms with the majority of buys (positive delta) have a green shade. Histograms with the maximal deviation value, positive or negative delta for the period will be the longest, brightest and non-transparent.
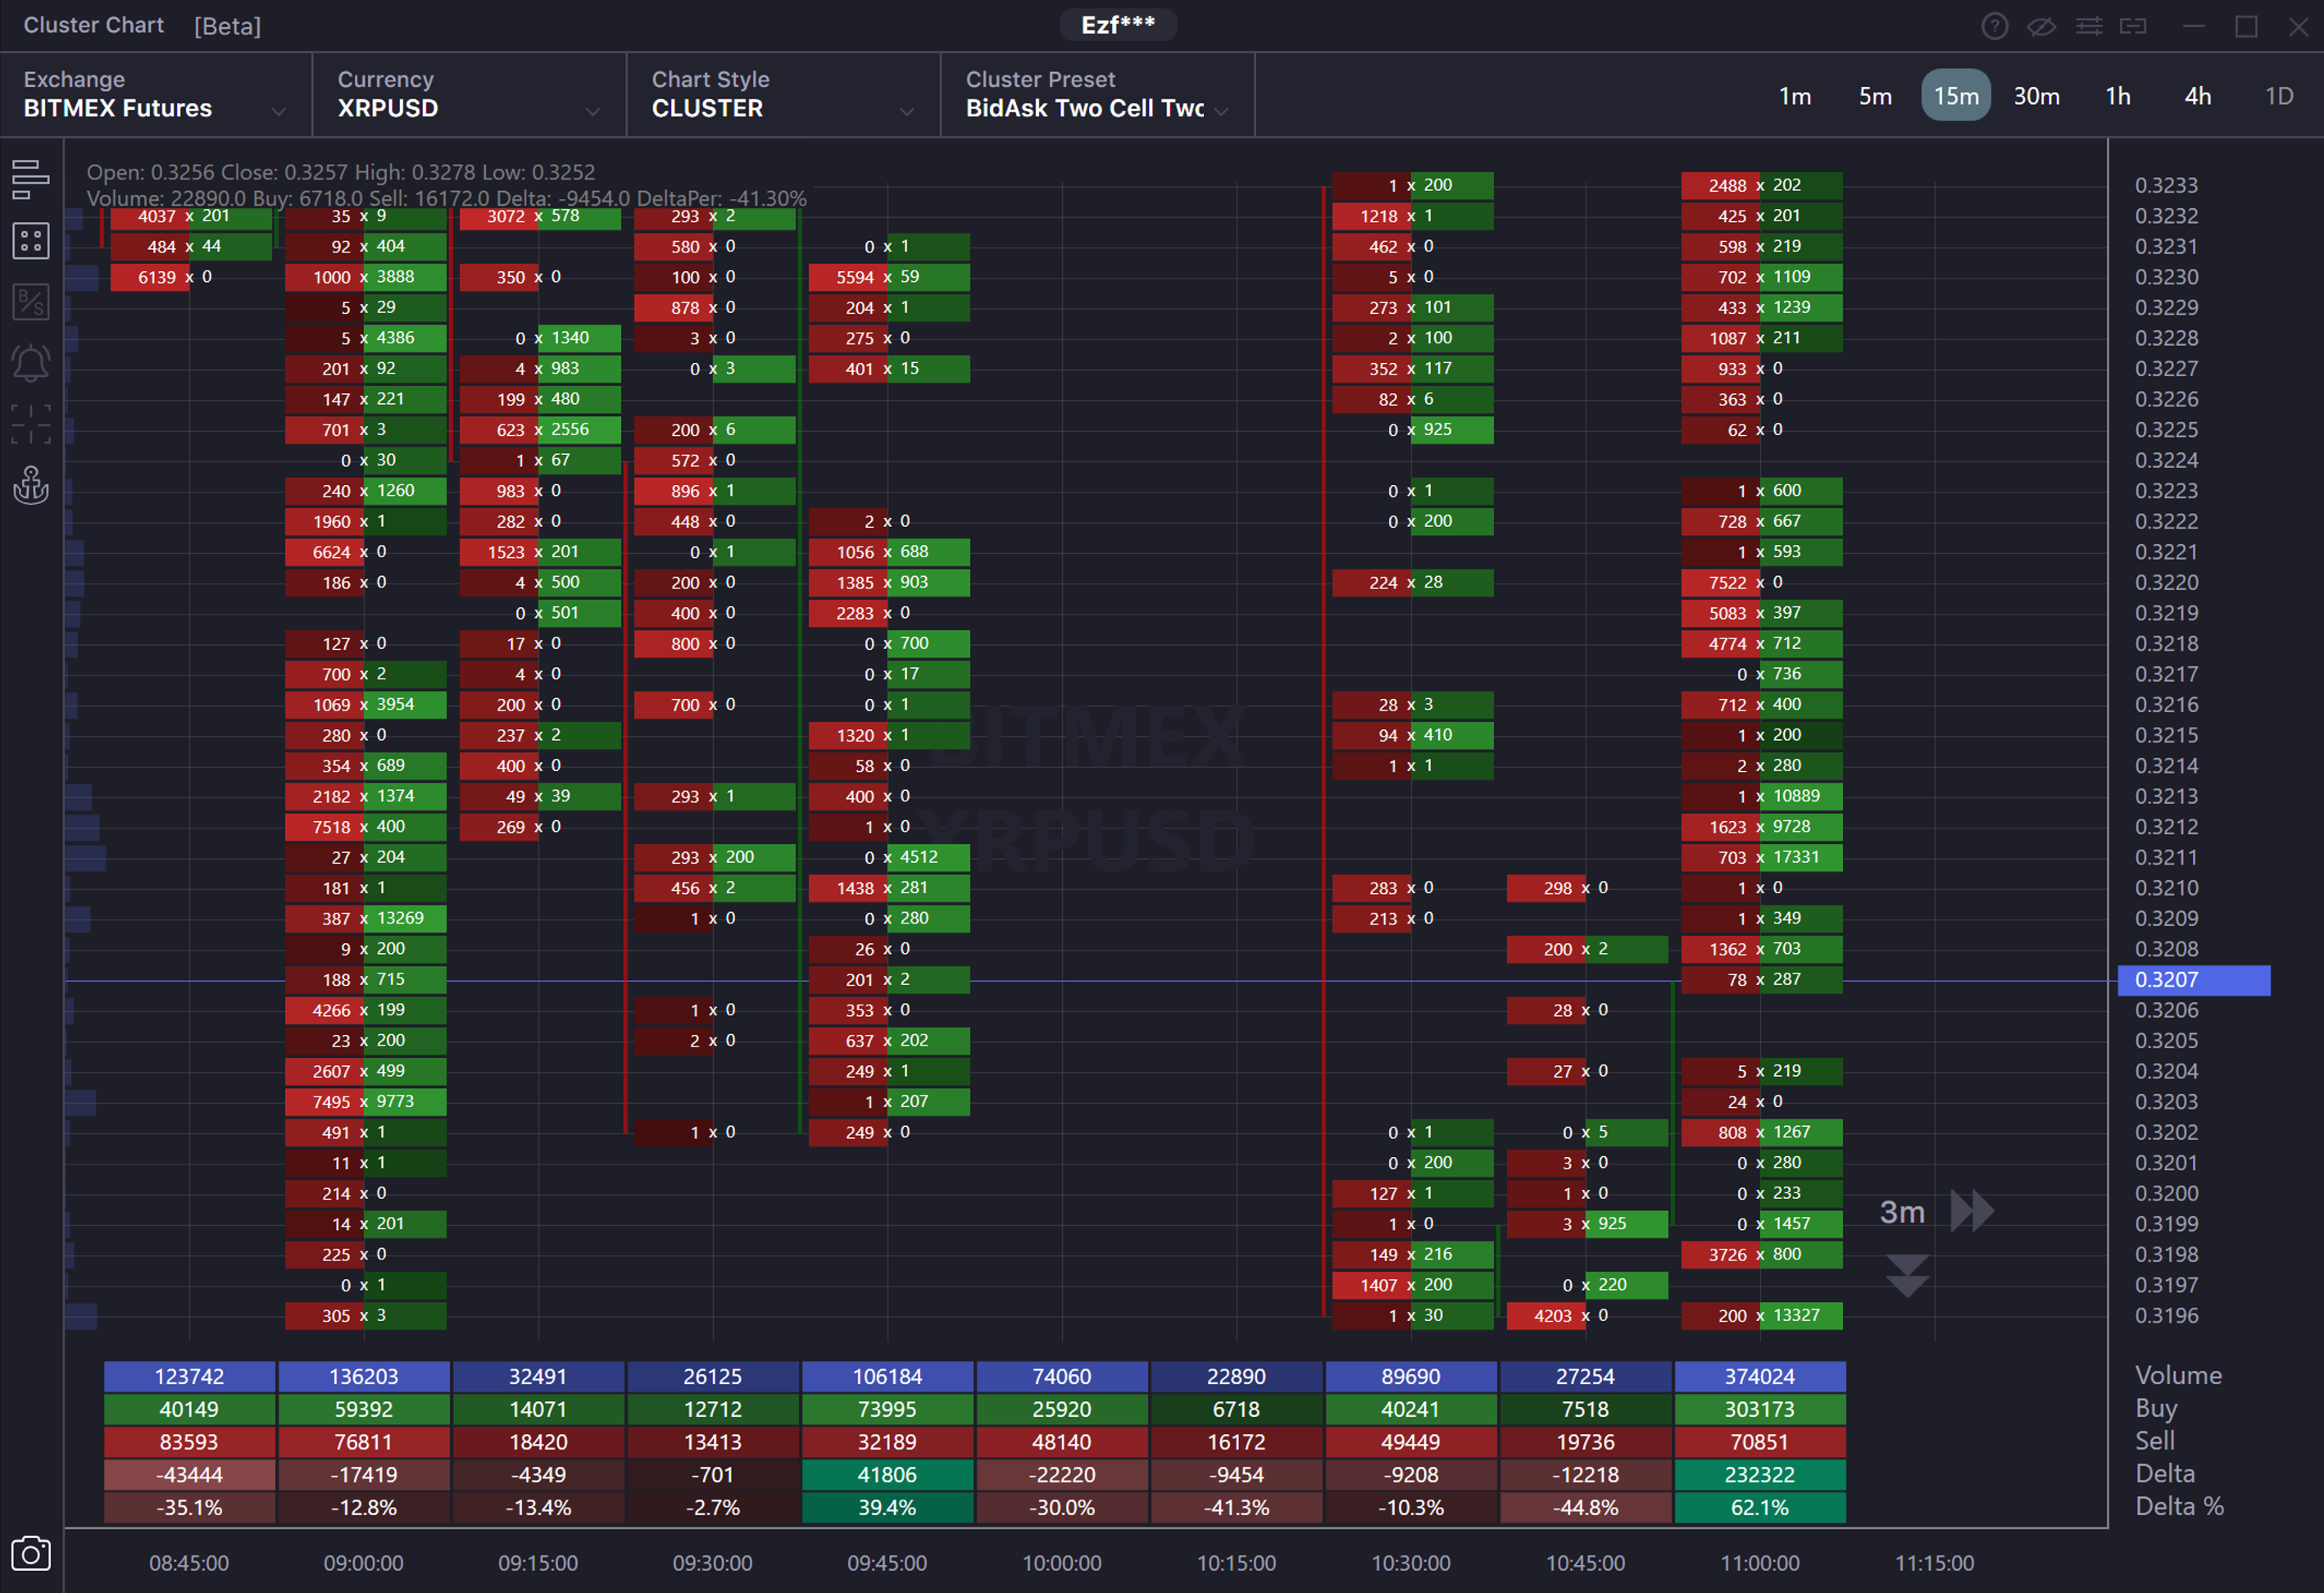
BidAsk two Cell two Gradient - The cluster displays two values, the traded volume in Bid (sales) and the traded volume in Ask ( buys) by price over a time frame. The data is shown in two cells which have different colors, transparency, and brightness. The cells on the left show the traded volume in Bid ( sells) at the selected price over a time frame and colored red. The cell with the maximum selling volume over a time frame will be the brightest and not transparent. The cells on the right show the volume of trades in Ask (buys) at the selected price over a time frame are colored green. The cell with the maximum buying volume will be the brightest and not transparent.
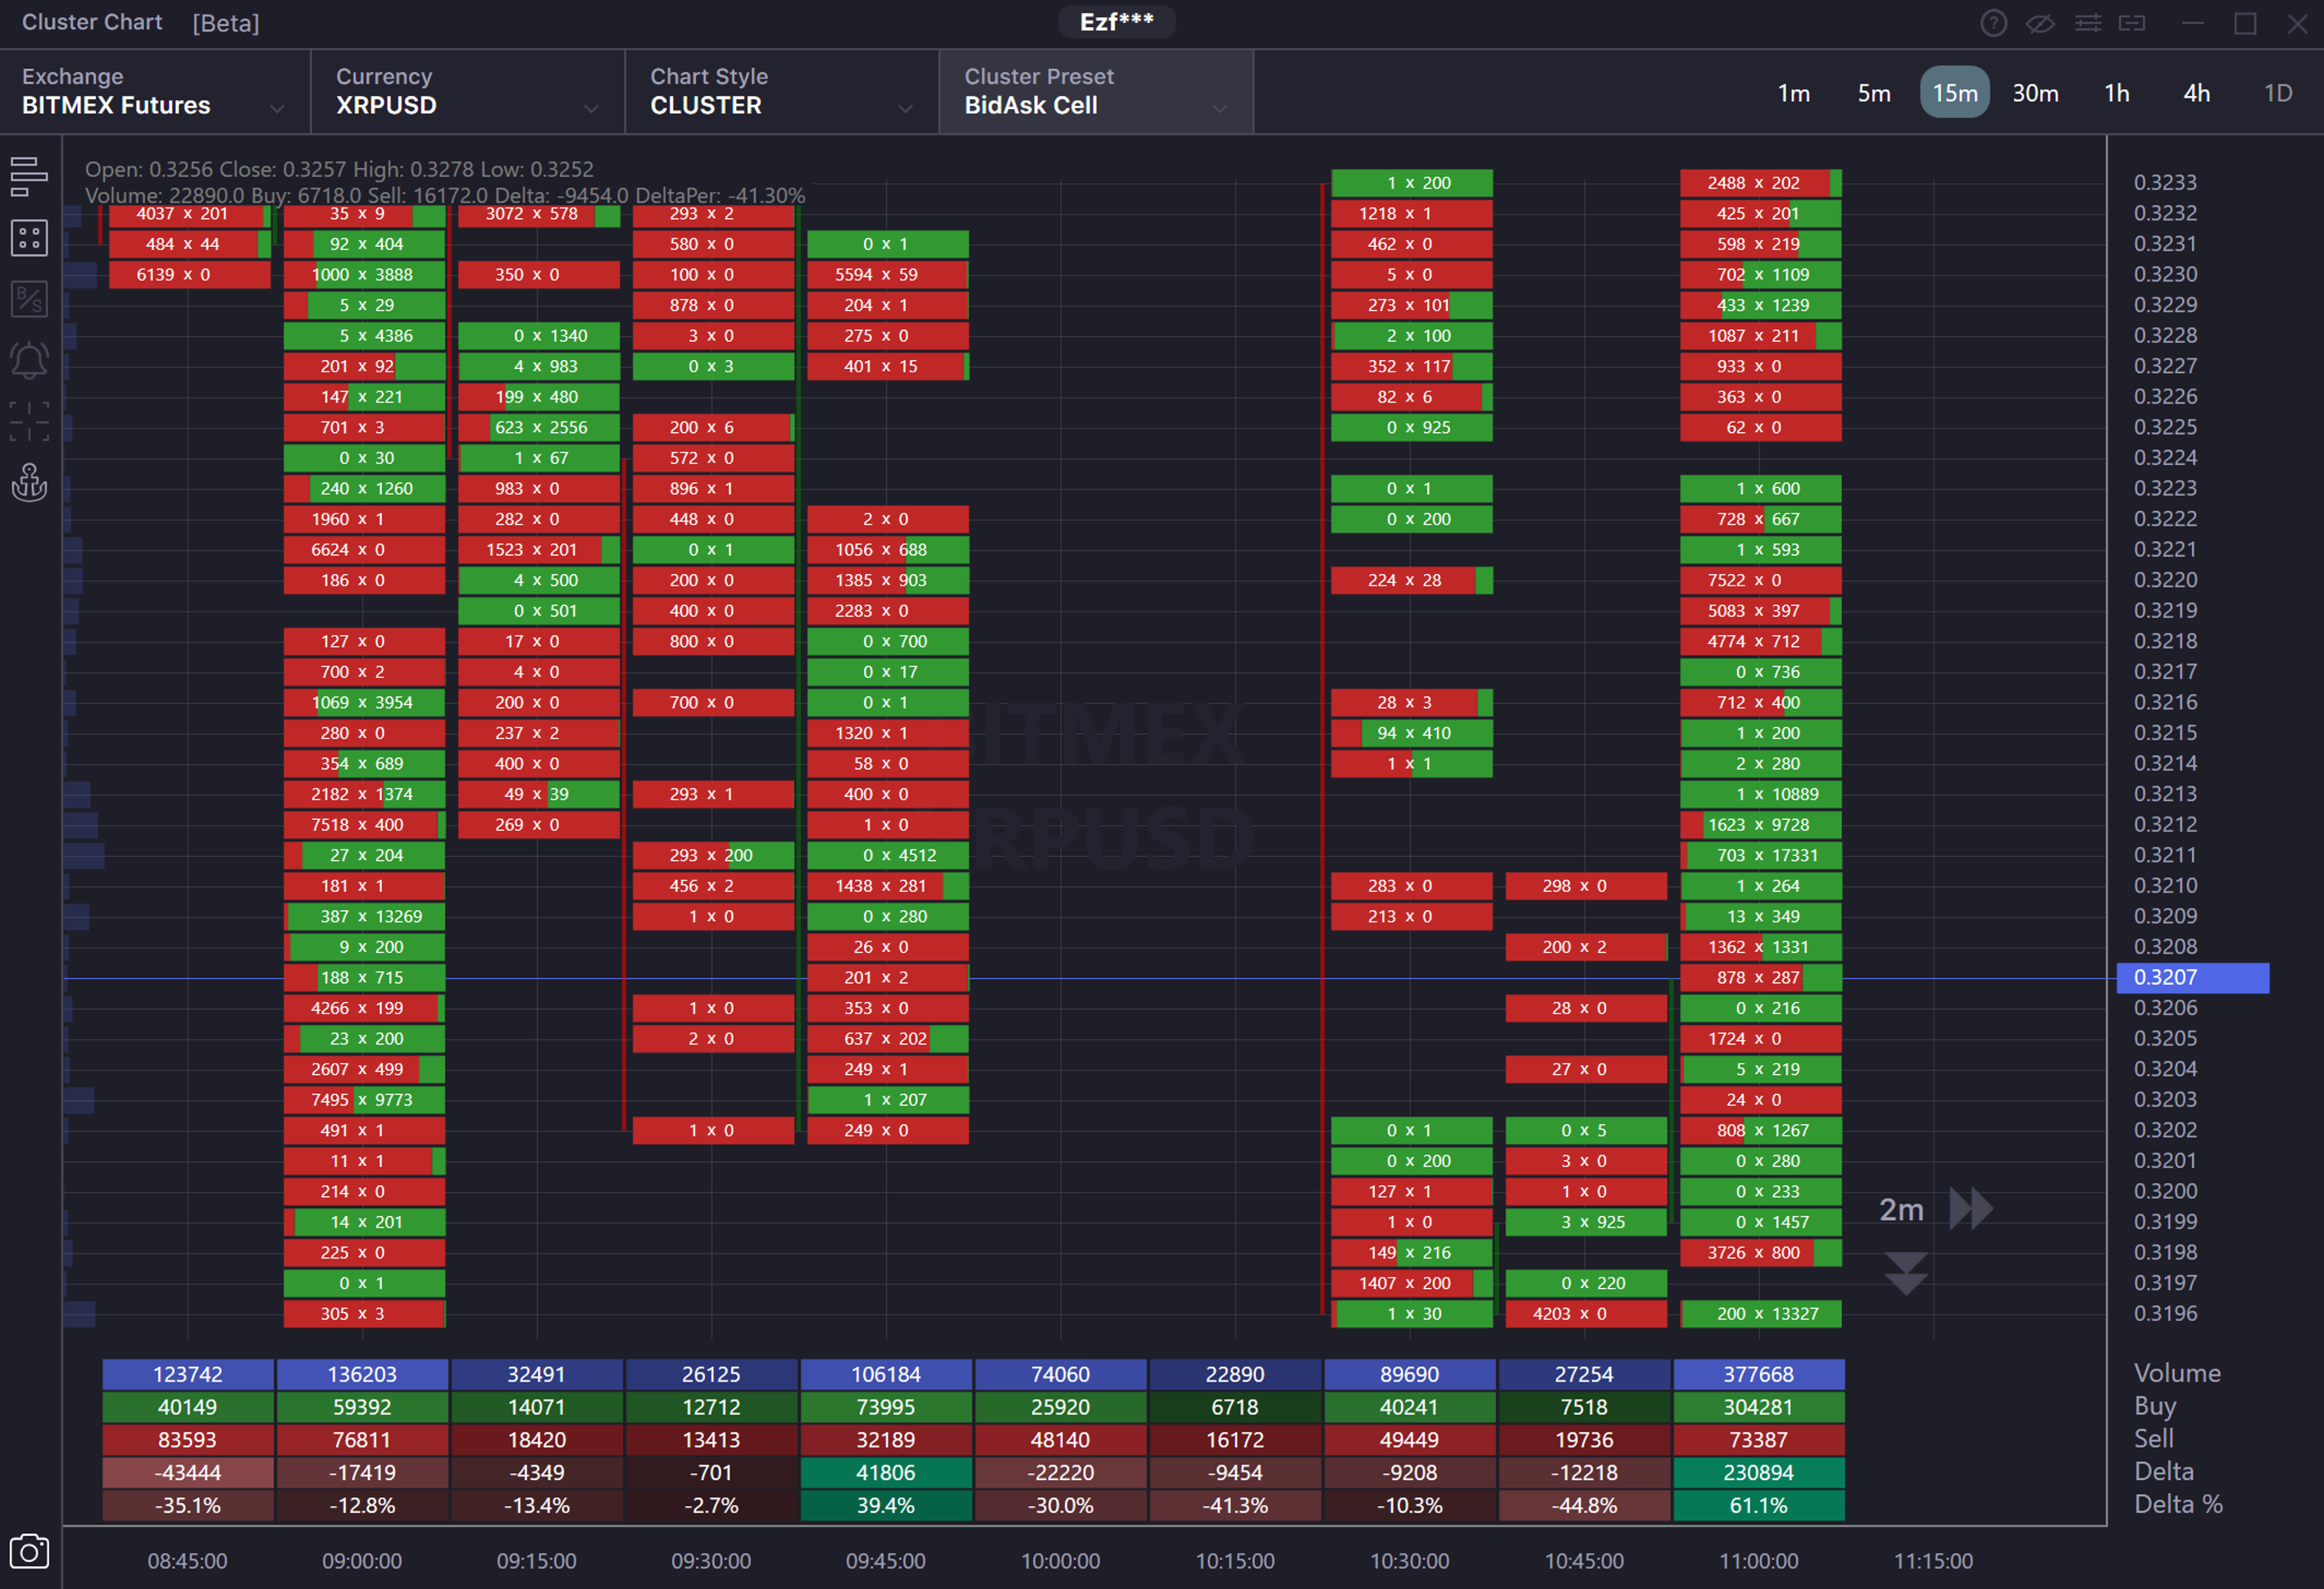
BidAsk Cell - The cluster displays two values, the traded volume in Bid (sales) and the traded volume in Ask (buys) over a time frame. The data is shown in cells divided into two parts and painted in two colors. The size of each side depends on the ratio of sales and buys at that price. The left side of the cell is colored red and shows Bid (sales) trades, and the right side is colored green and shows Ask ( buys) trades. Cells with high selling domination mostly may be colored in red. If buying prevails, most of the cells will be green.
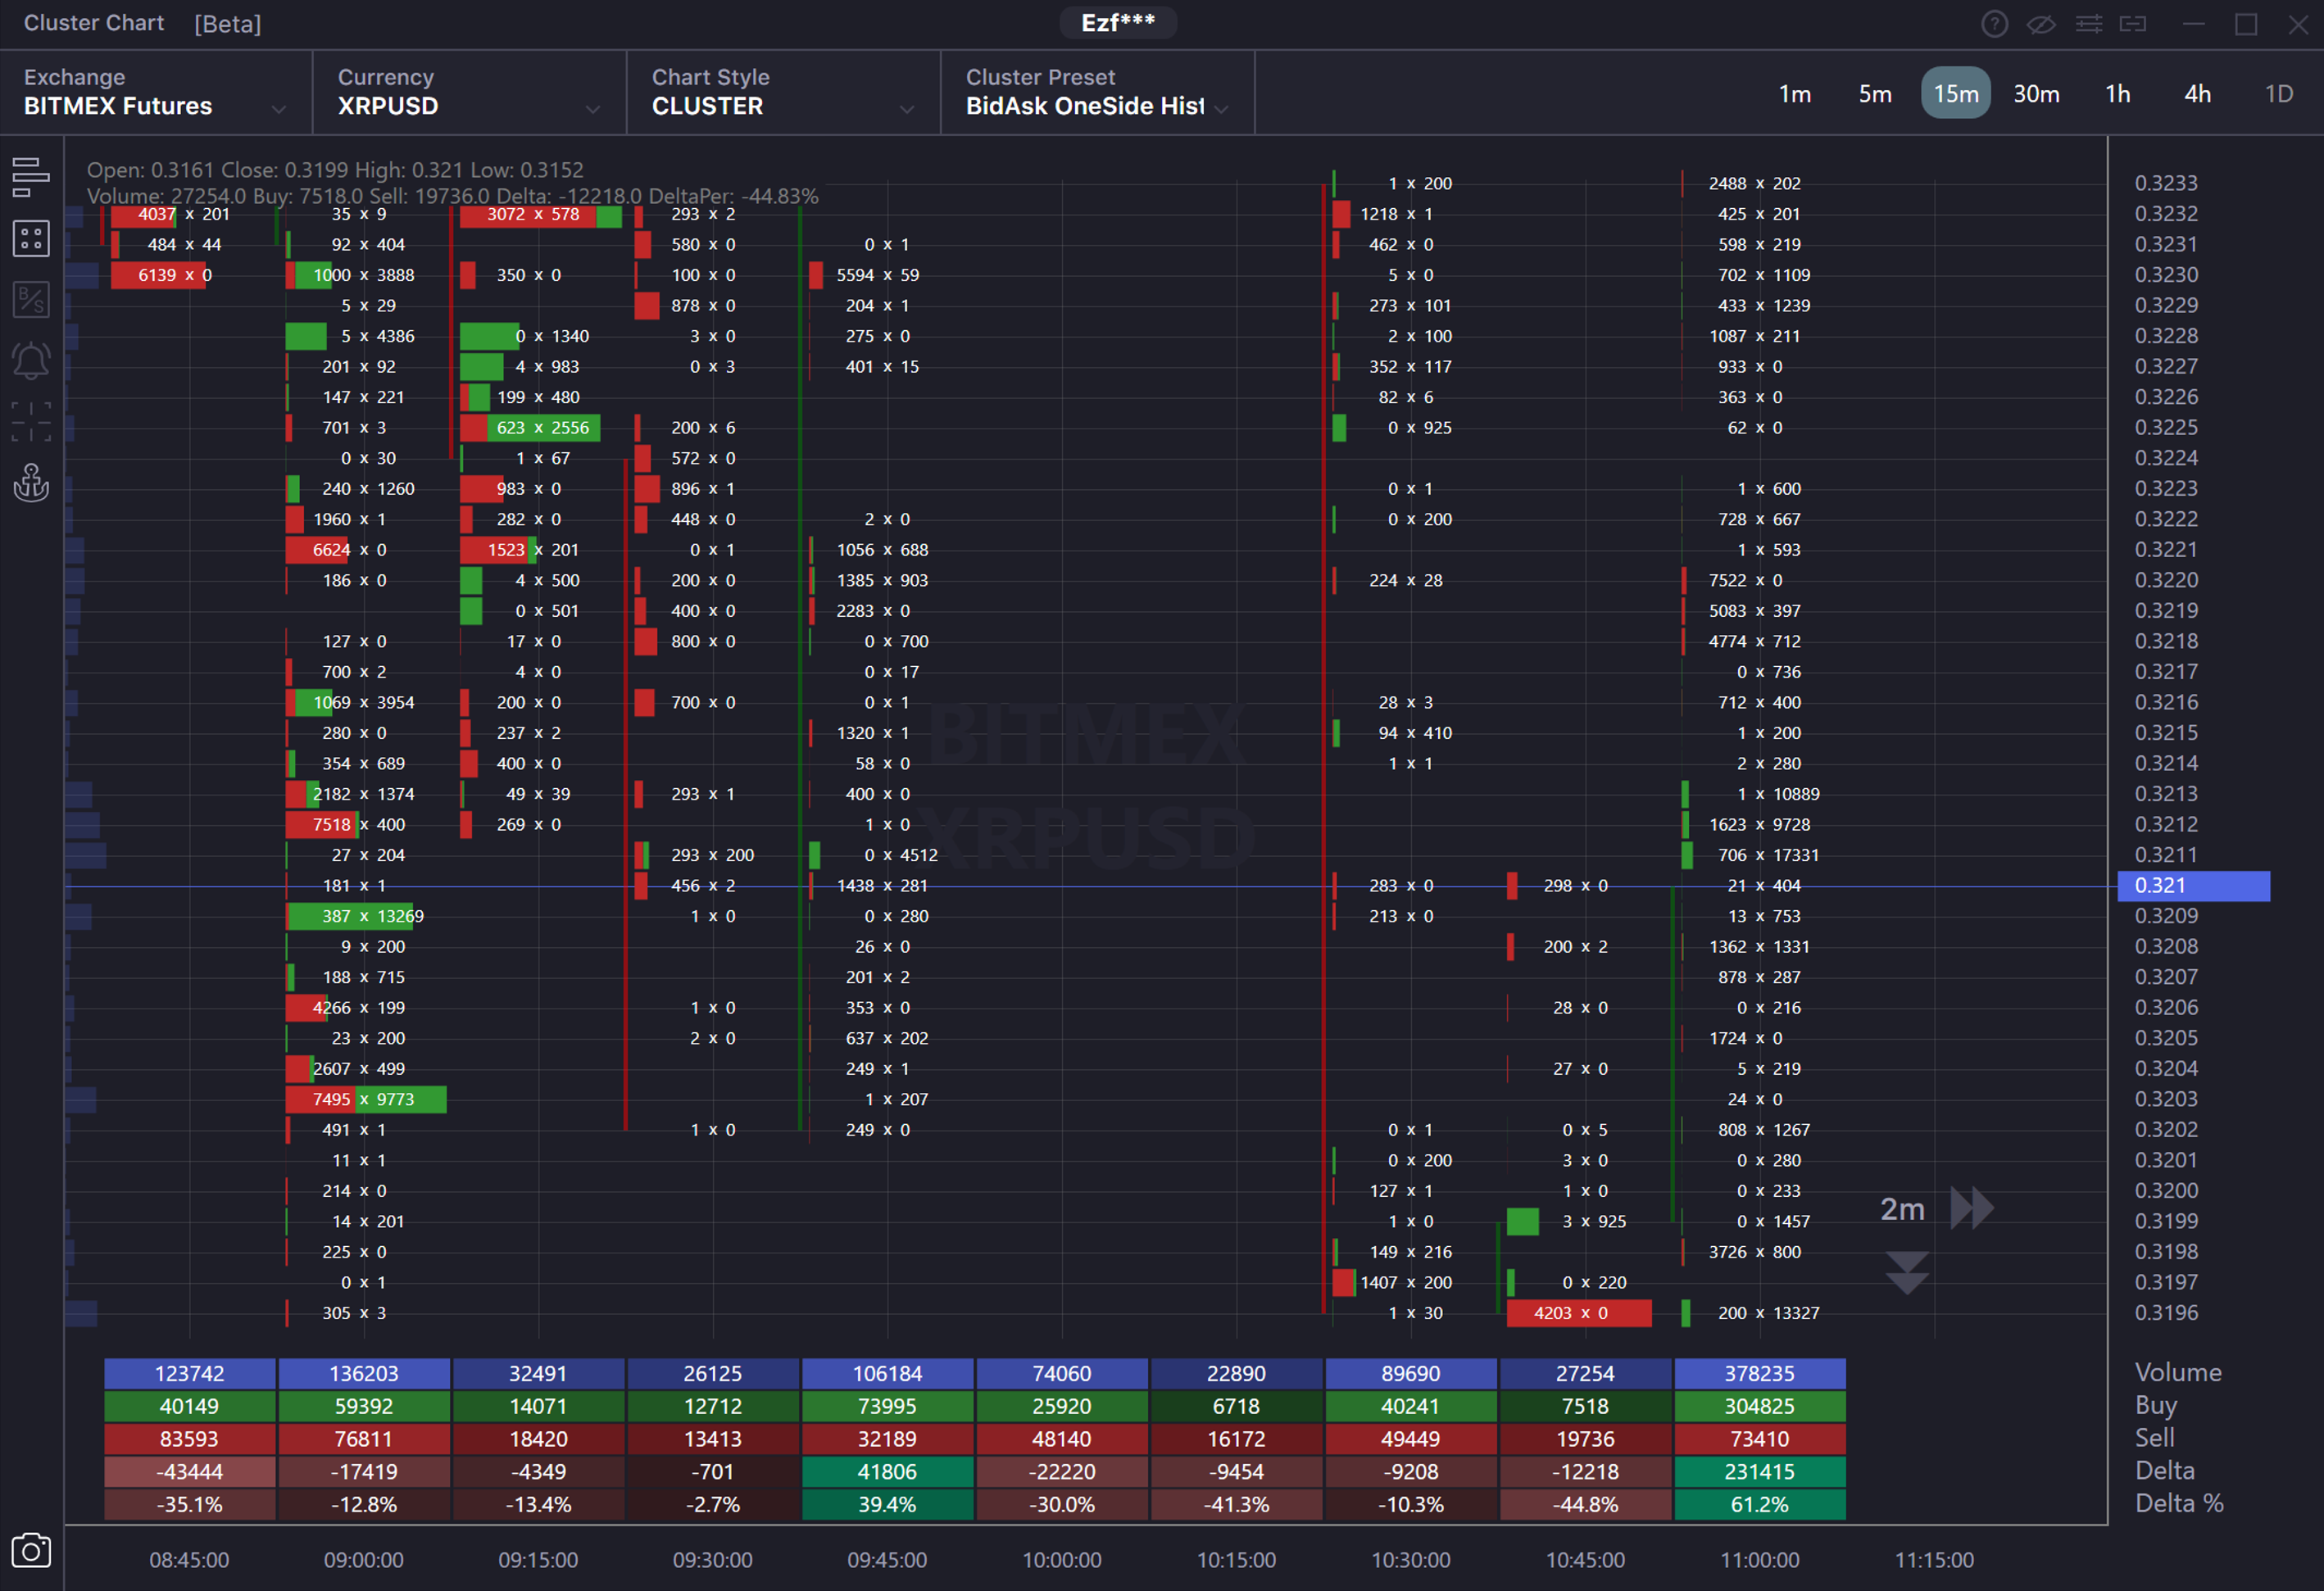
BidAsk oneside Histogram - The cluster shows two values, the traded volume in Bid (sales) and the traded volume in Ask ( buys) by price over a time frame. The data is shown in one-way histograms with different length levels divided into two parts and painted in two colors. The length of the histogram depends on the total traded volume at the selected price for the period. The longest histogram will have the maximum traded volume (sum of buys and sells), and the shortest histogram will have the minimum volume. The division of the histogram into two parts depends on the ratio of sales volume to buys at that price. The left part of the histogram is colored red and shows Bids (sells), and the right part is colored green and shows Asks ( buys). A histogram with a significant prevalence of sales will be colored red. If buying prevails, most of the histogram will be green.
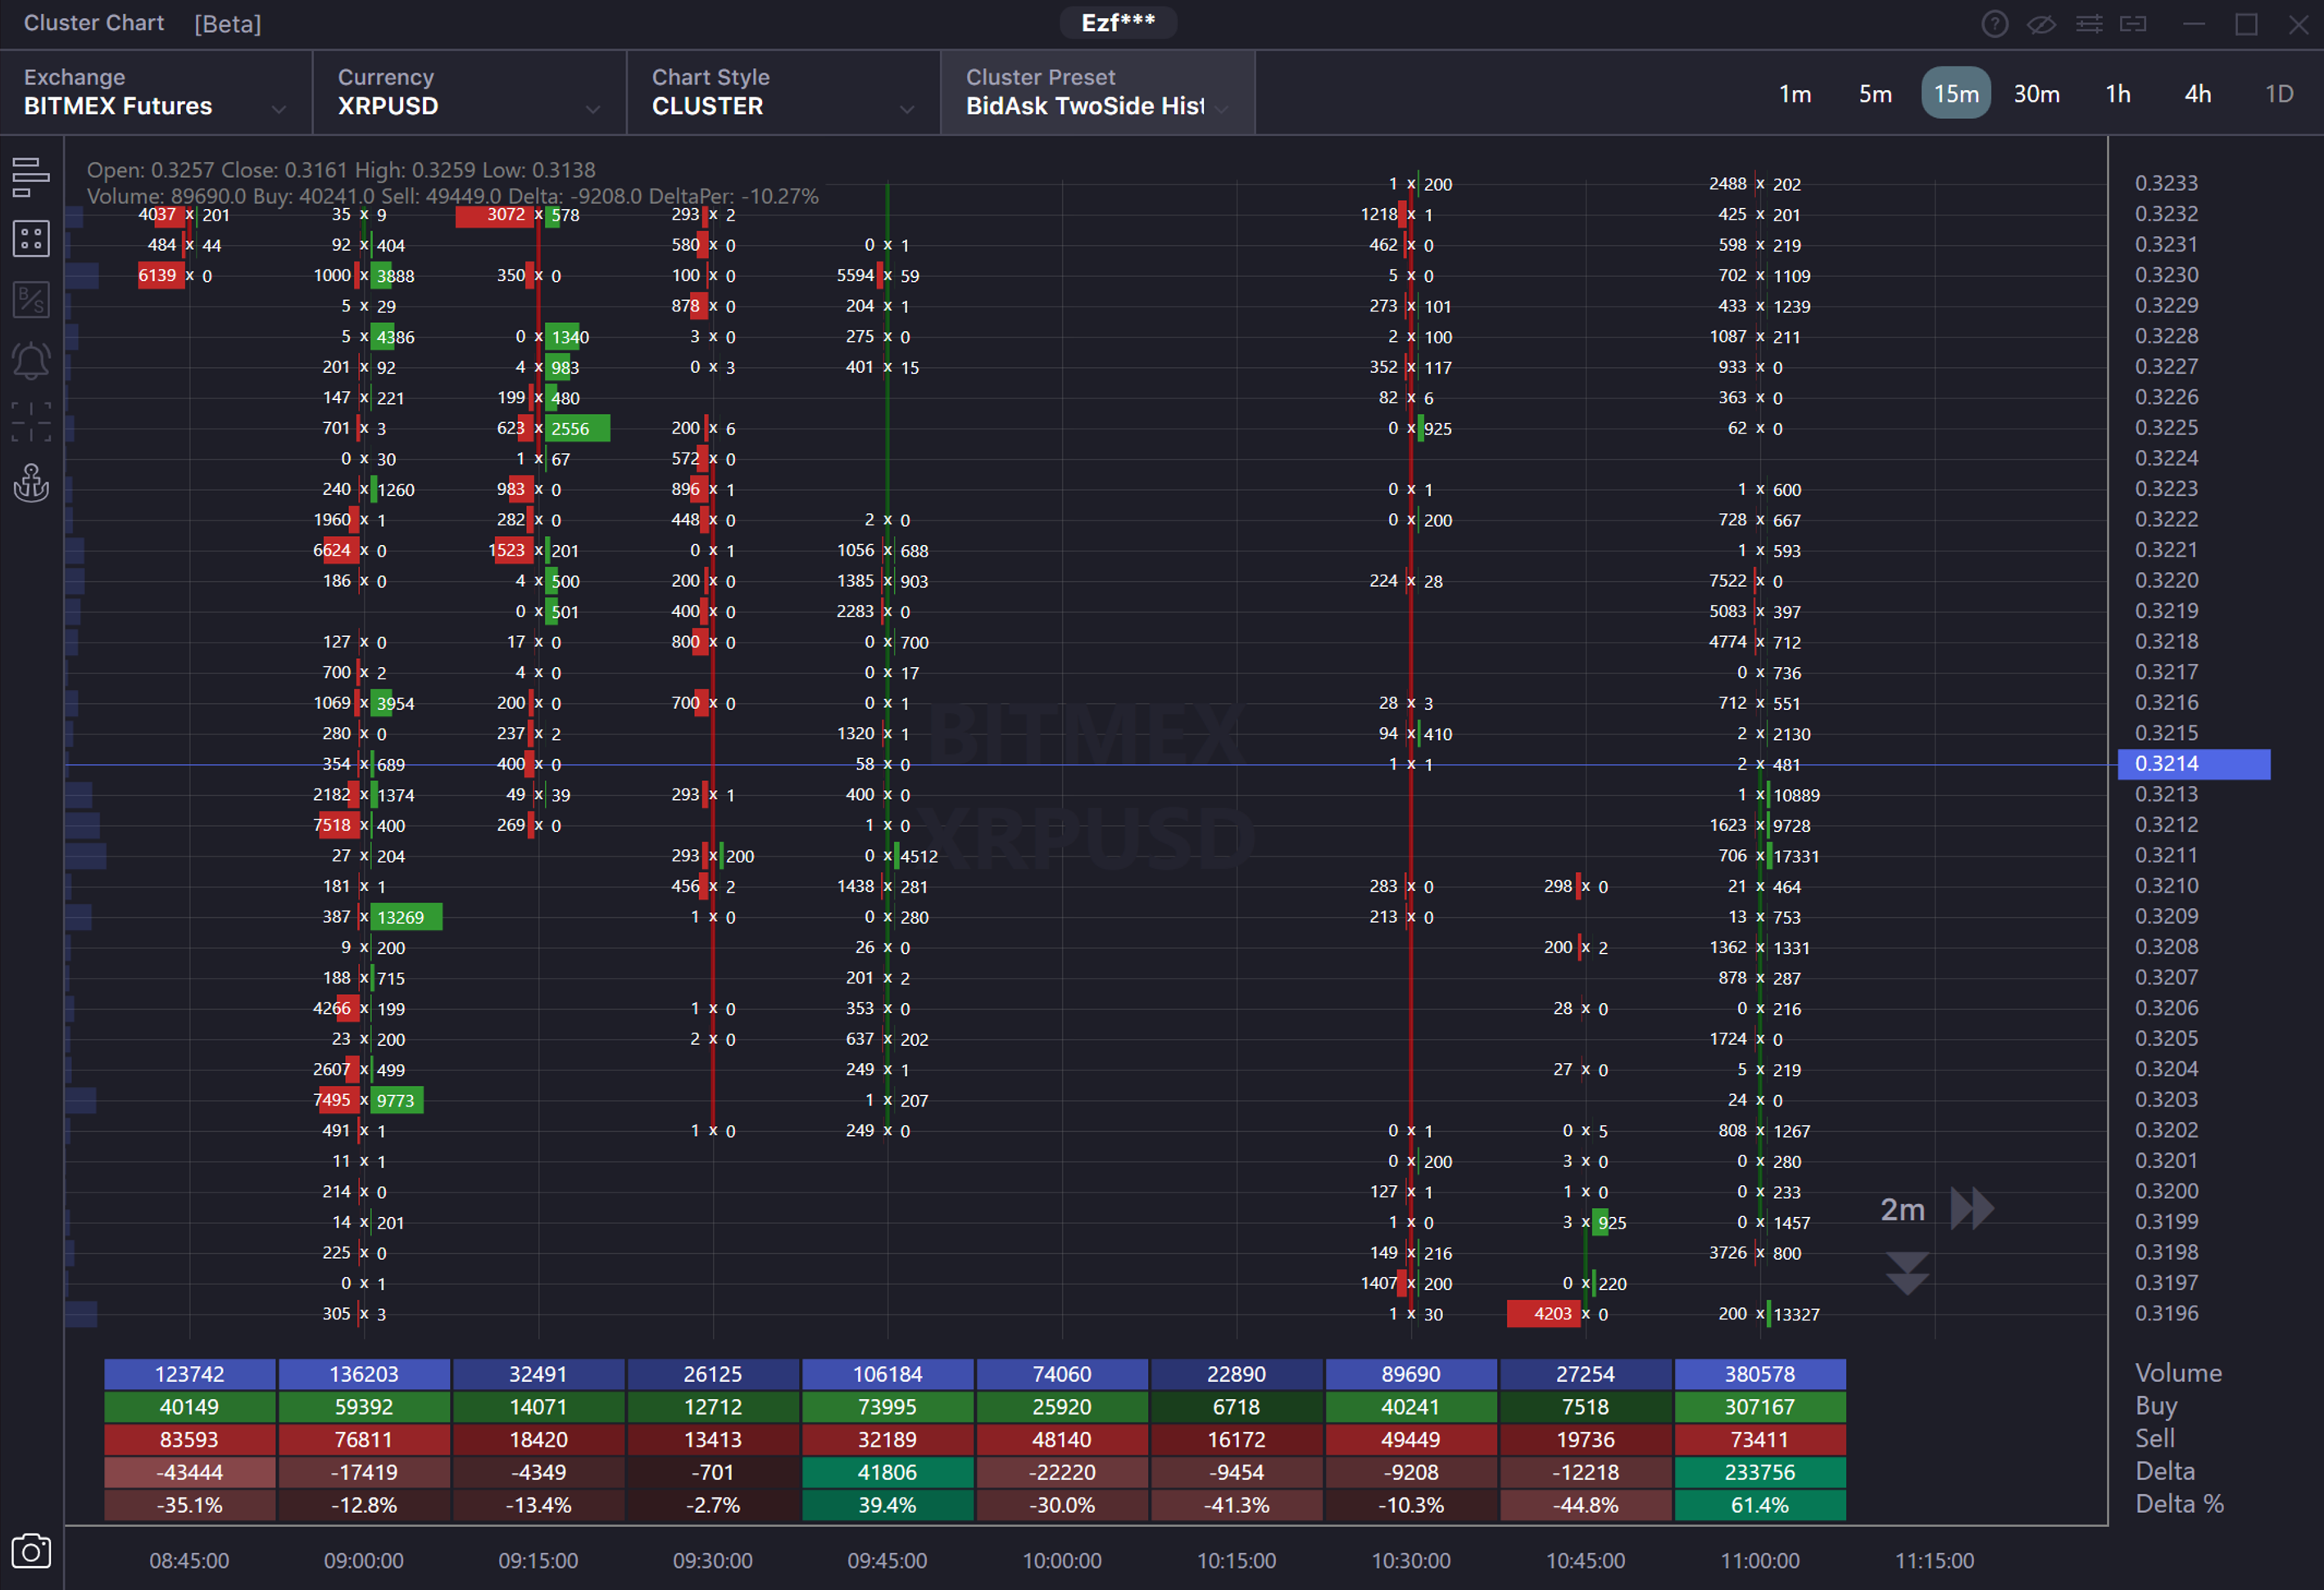
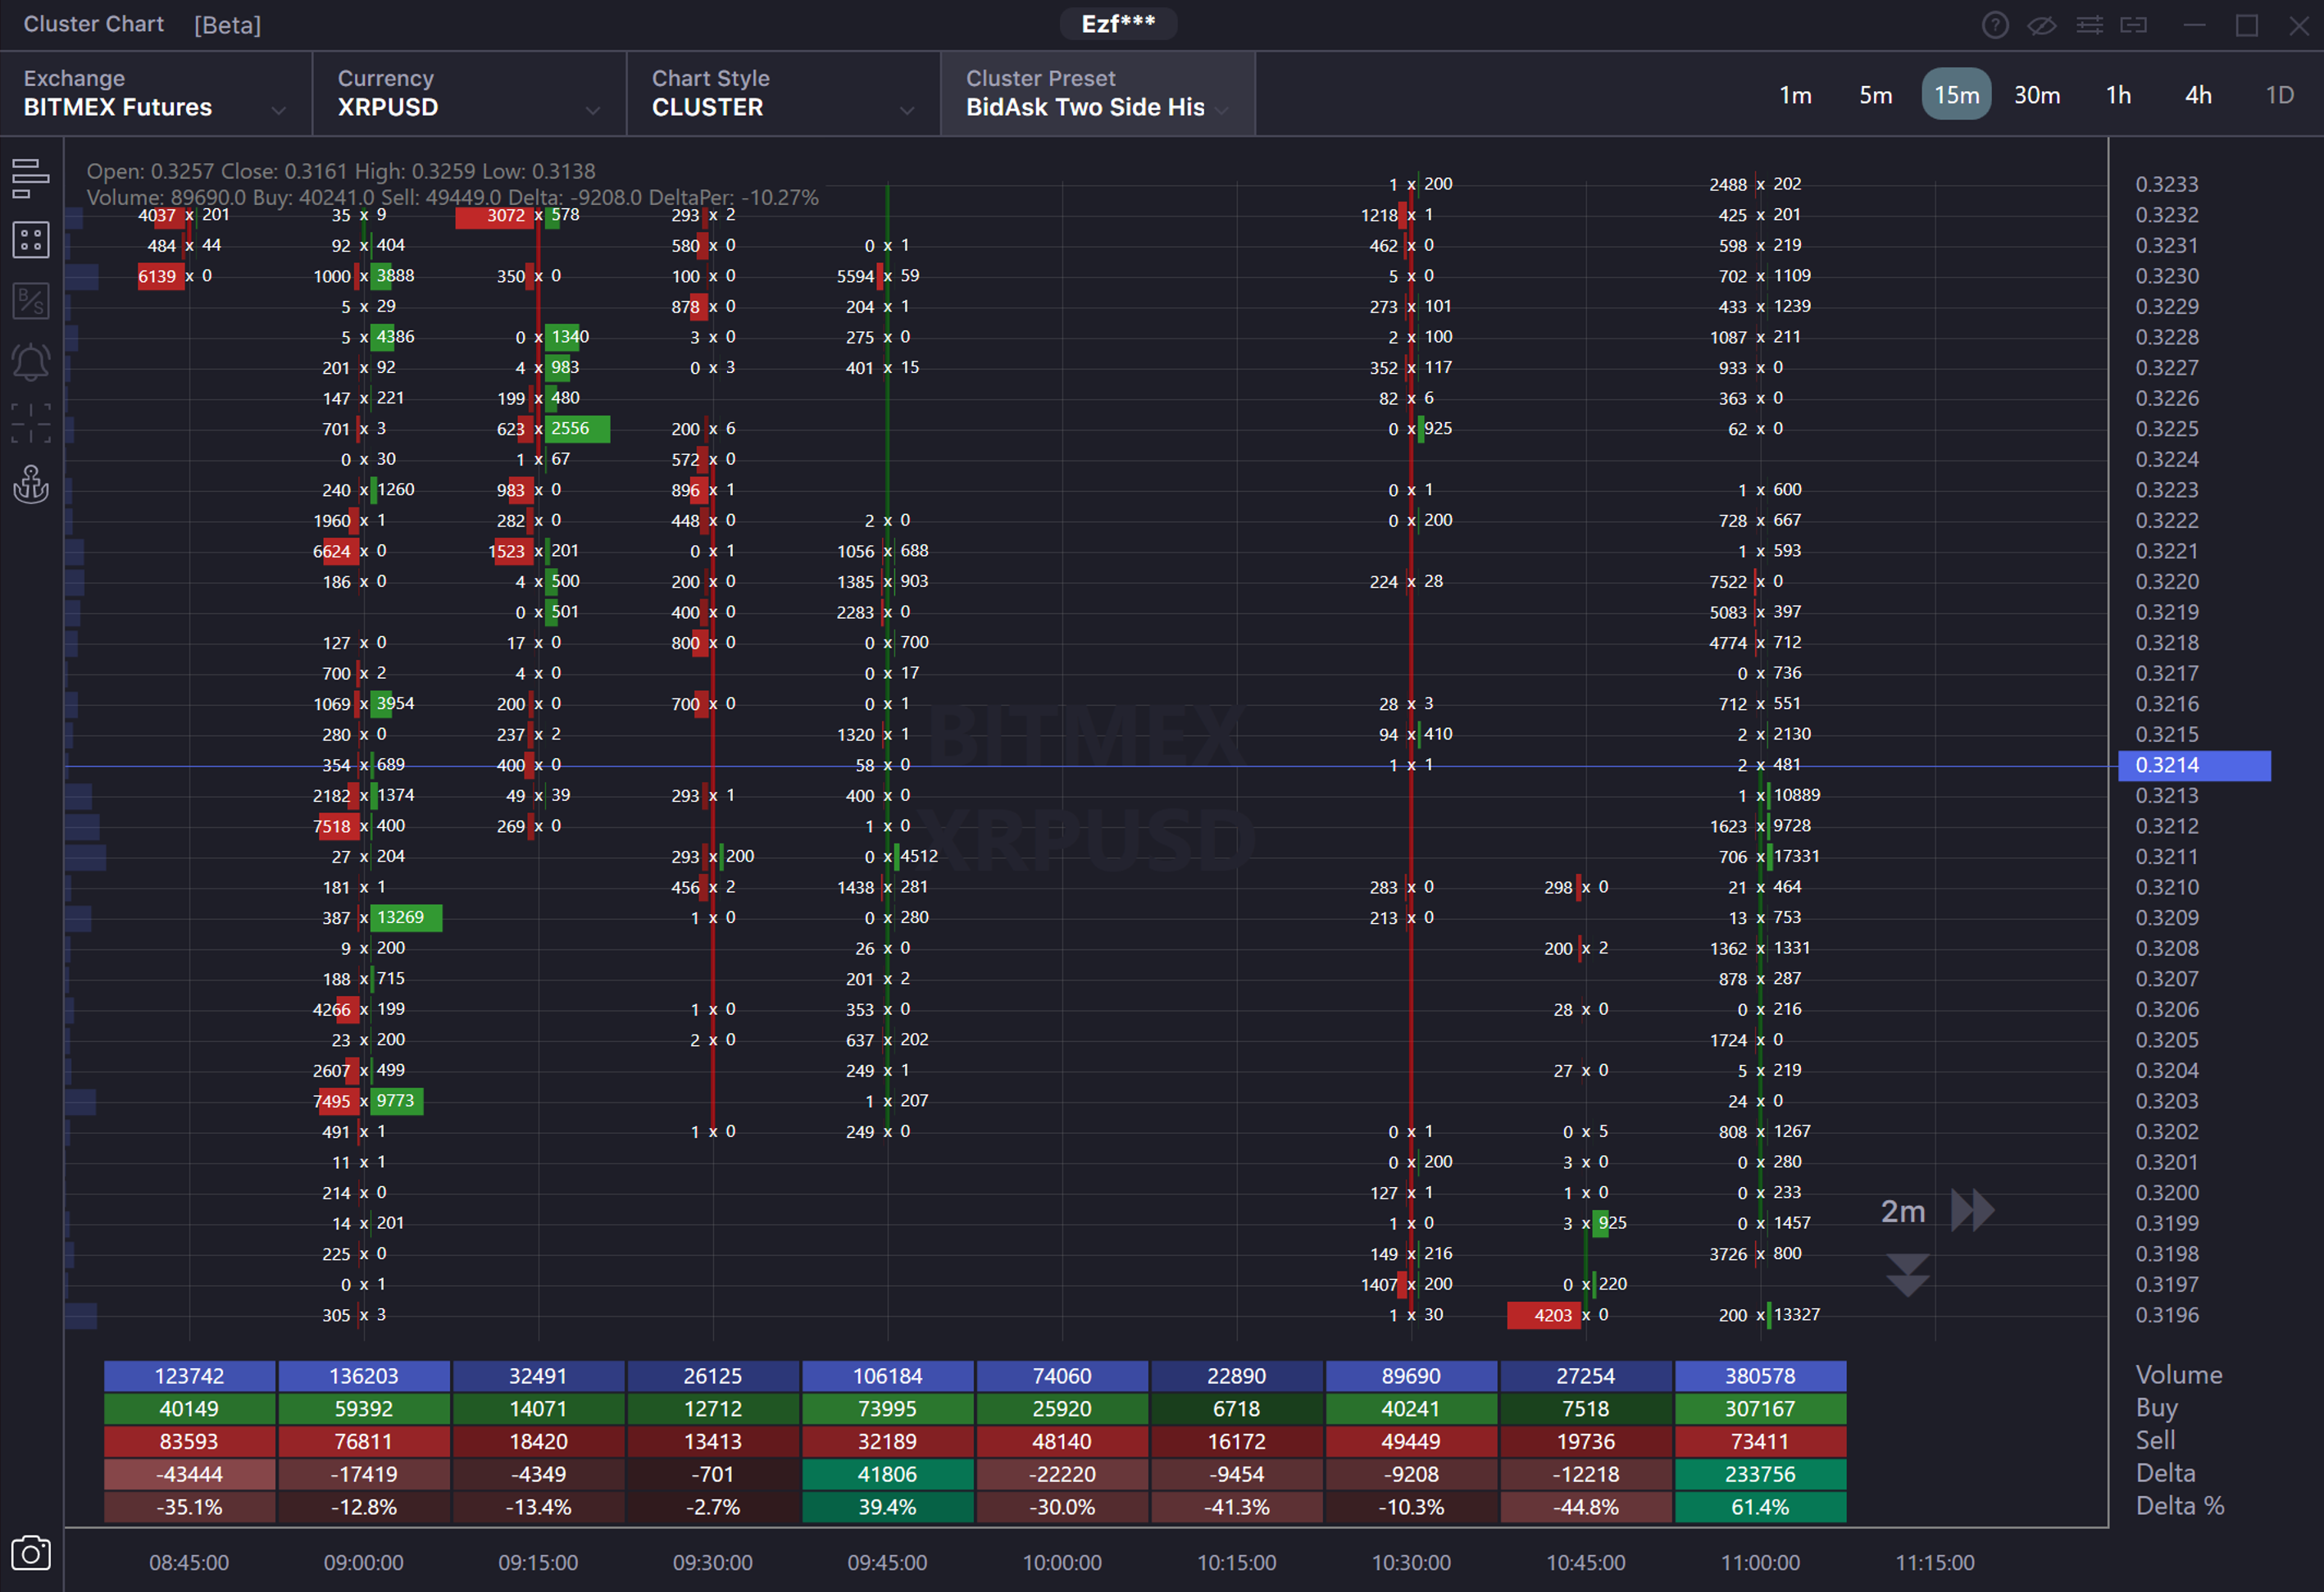
BidAsk two side histogram - The cluster shows two values: the traded volume in Bid ( sells) and the traded volume in Ask ( buys) by price over a time frame. The data is shown in two-side histograms with different colors and lengths. On the left, you will see histograms of traded volume in Bid ( sells) at the selected price over a time frame, colored in red. The length of the histogram depends on the total sales volume at a price over a time frame. On the right, green-colored histograms showing the trading volume in Ask (buying) at the selected price over a time frame. The length of the histogram depends on the overall volume of buys at a price for the period.
BidAsk two side histogram two Gradient - The cluster shows two values: the traded volume in Bid ( sells) and the traded volume in Ask ( buys) by price over the time frame. The data is displayed by a two-sided histogram of different lengths, colors, transparency, and brightness. Histograms of traded volume in Bid ( sells) at the selected price over the time frame are displayed on the left and colored in red. The length of the histogram depends on the total bids volume at a price over the time frame. The histogram with the highest selling volume for the selected time will be the brightest and not transparent. On the right, histograms of trading volume in Ask ( buys) are displayed at the selected price over the time frame and colored in green. The length of the histogram depends on the total buy volume over a price for the period. Also, the histogram with the maximum volume of buys over the time frame will be the brightest.
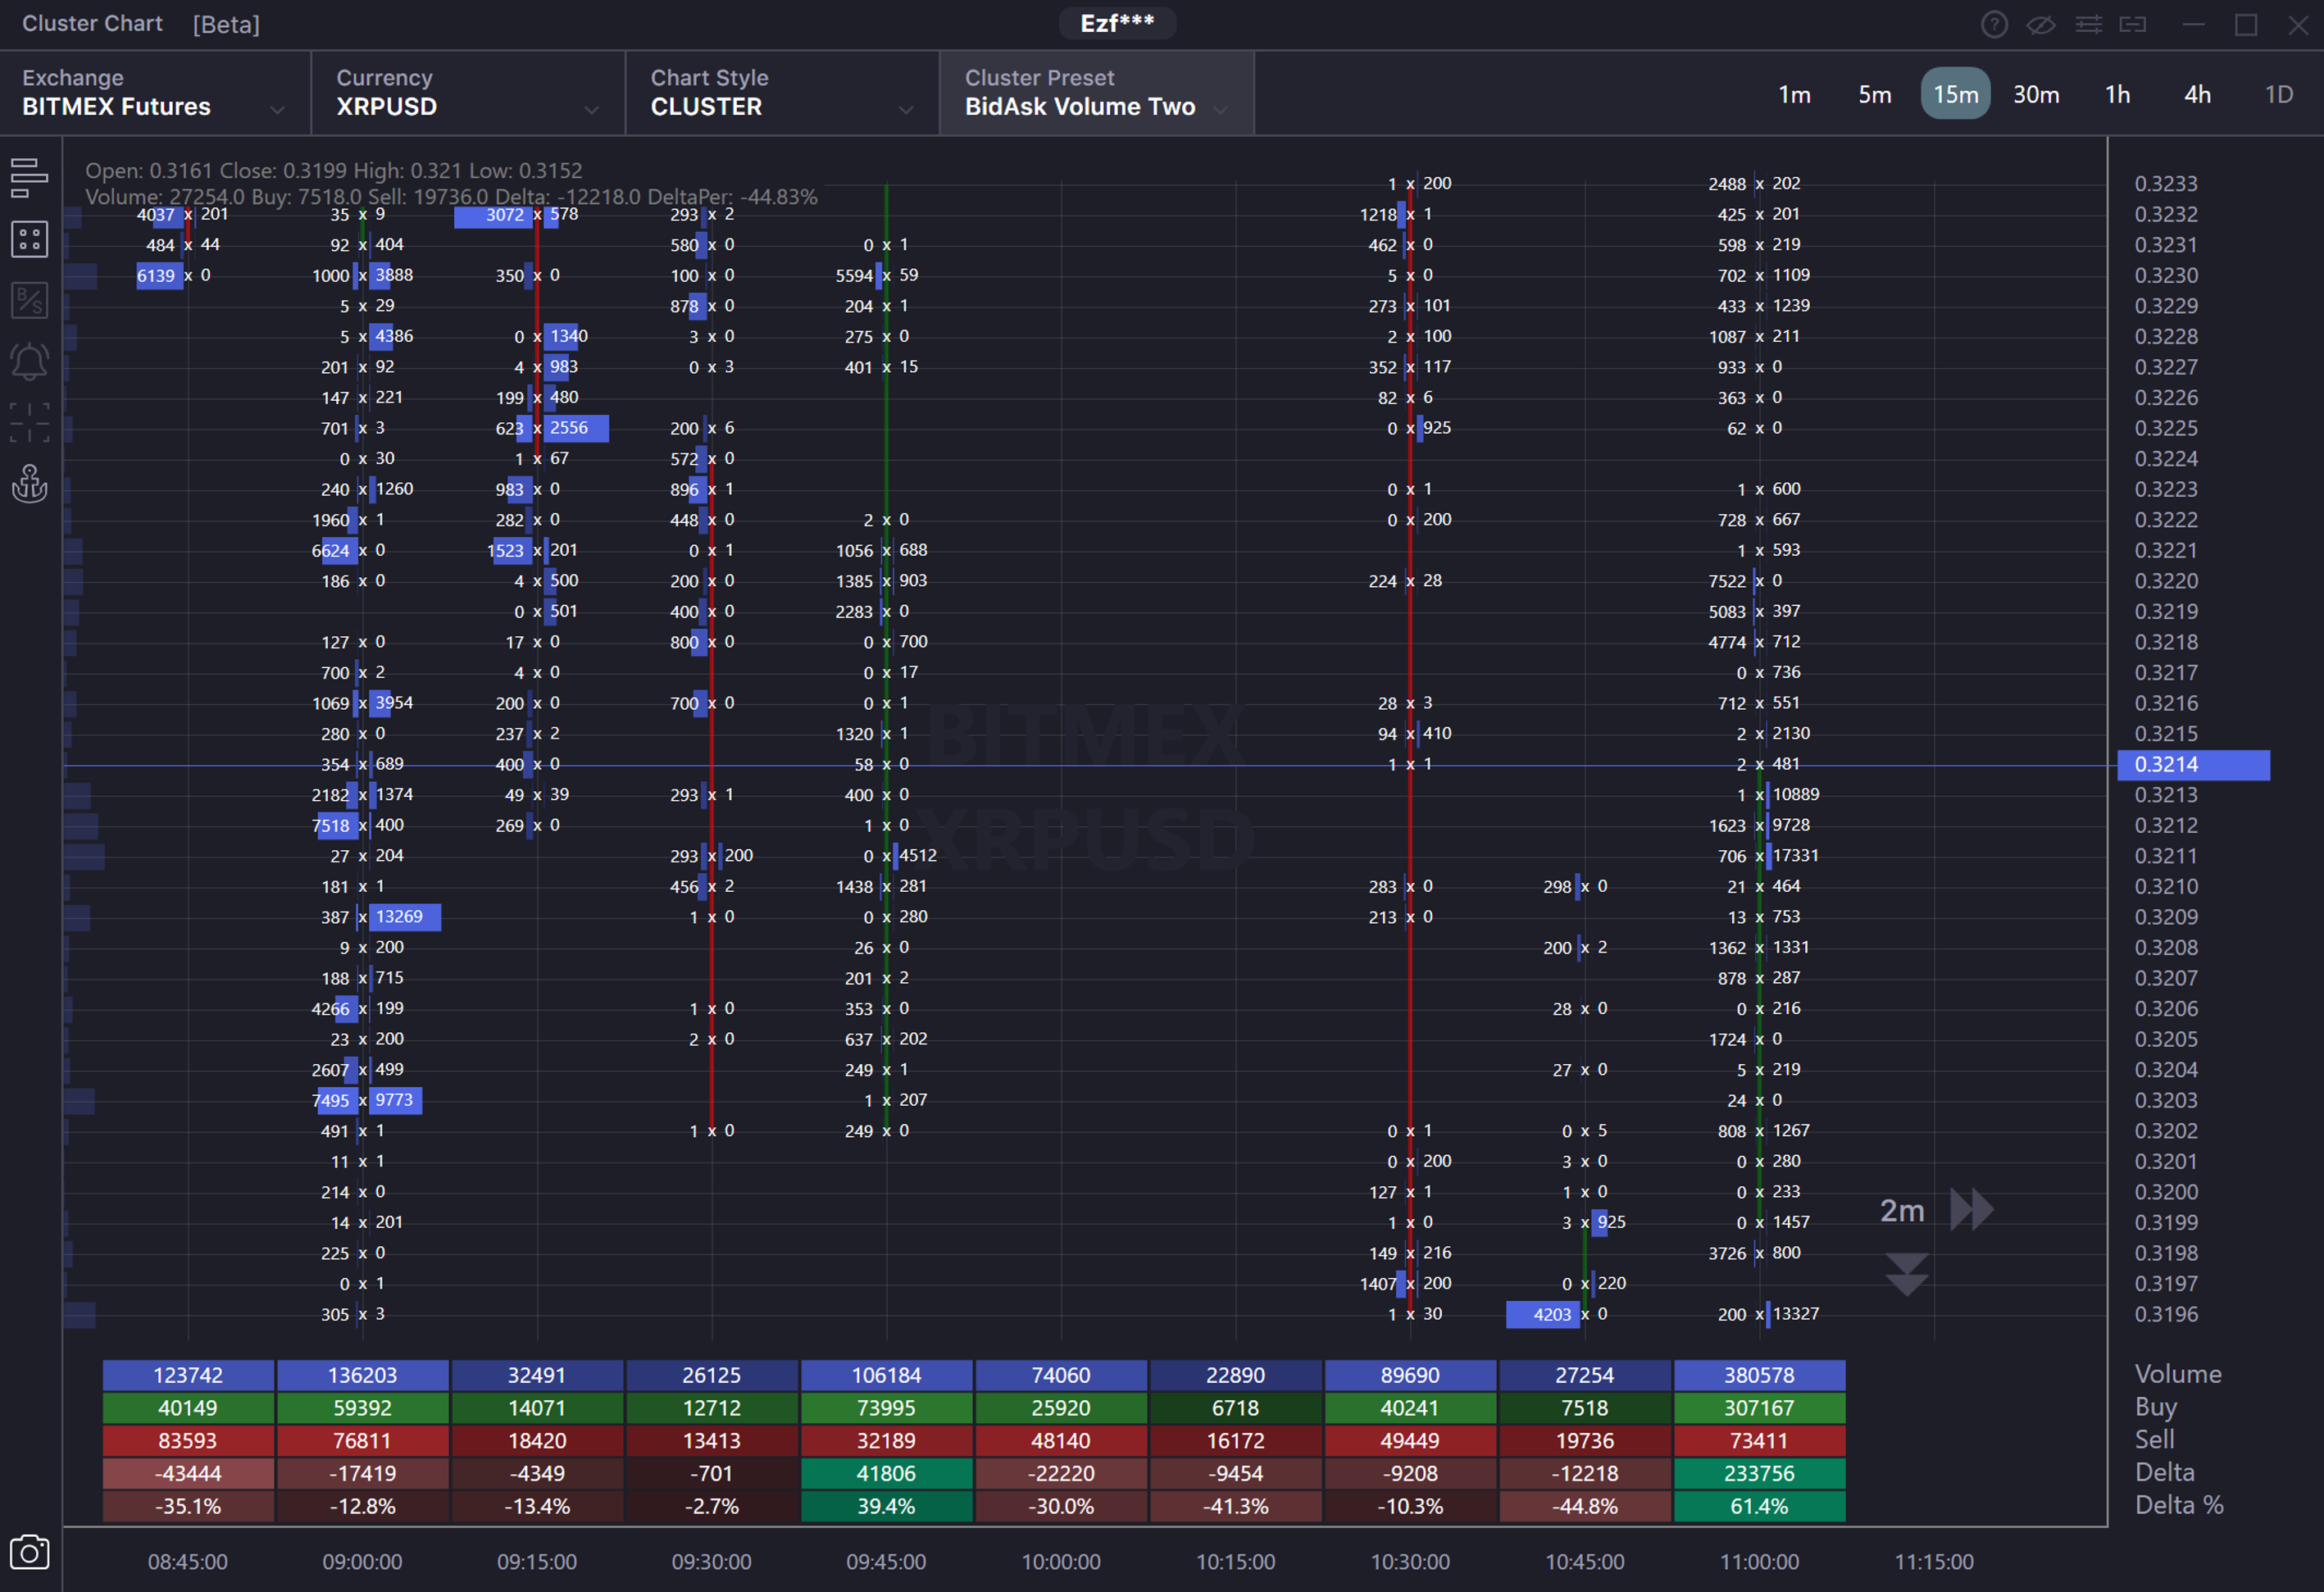
BidAsk Volume two side histogram one Gradient - The cluster shows two values: traded volume in Bid ( sells) and traded volume in Ask ( buys) by price over the time frame. The data displays by a two-sided histogram of different lengths. Histograms of traded volume in Bid ( sells) at the selected price over the time frame are displayed on the left. The length of the histogram depends on the total bids volume at a price over the period. On the right, histograms of trading volume in Ask ( buy) at the selected price over the time frame are displayed. The length of the histogram depends on the total volume of buys at a price over the time frame. Both histograms will be colored in the same color with different levels of brightness and transparency. The brightness of the histograms depends on the total trading volume. The higher the total trading volume at a given price on the time frame, the brighter both histograms will be.
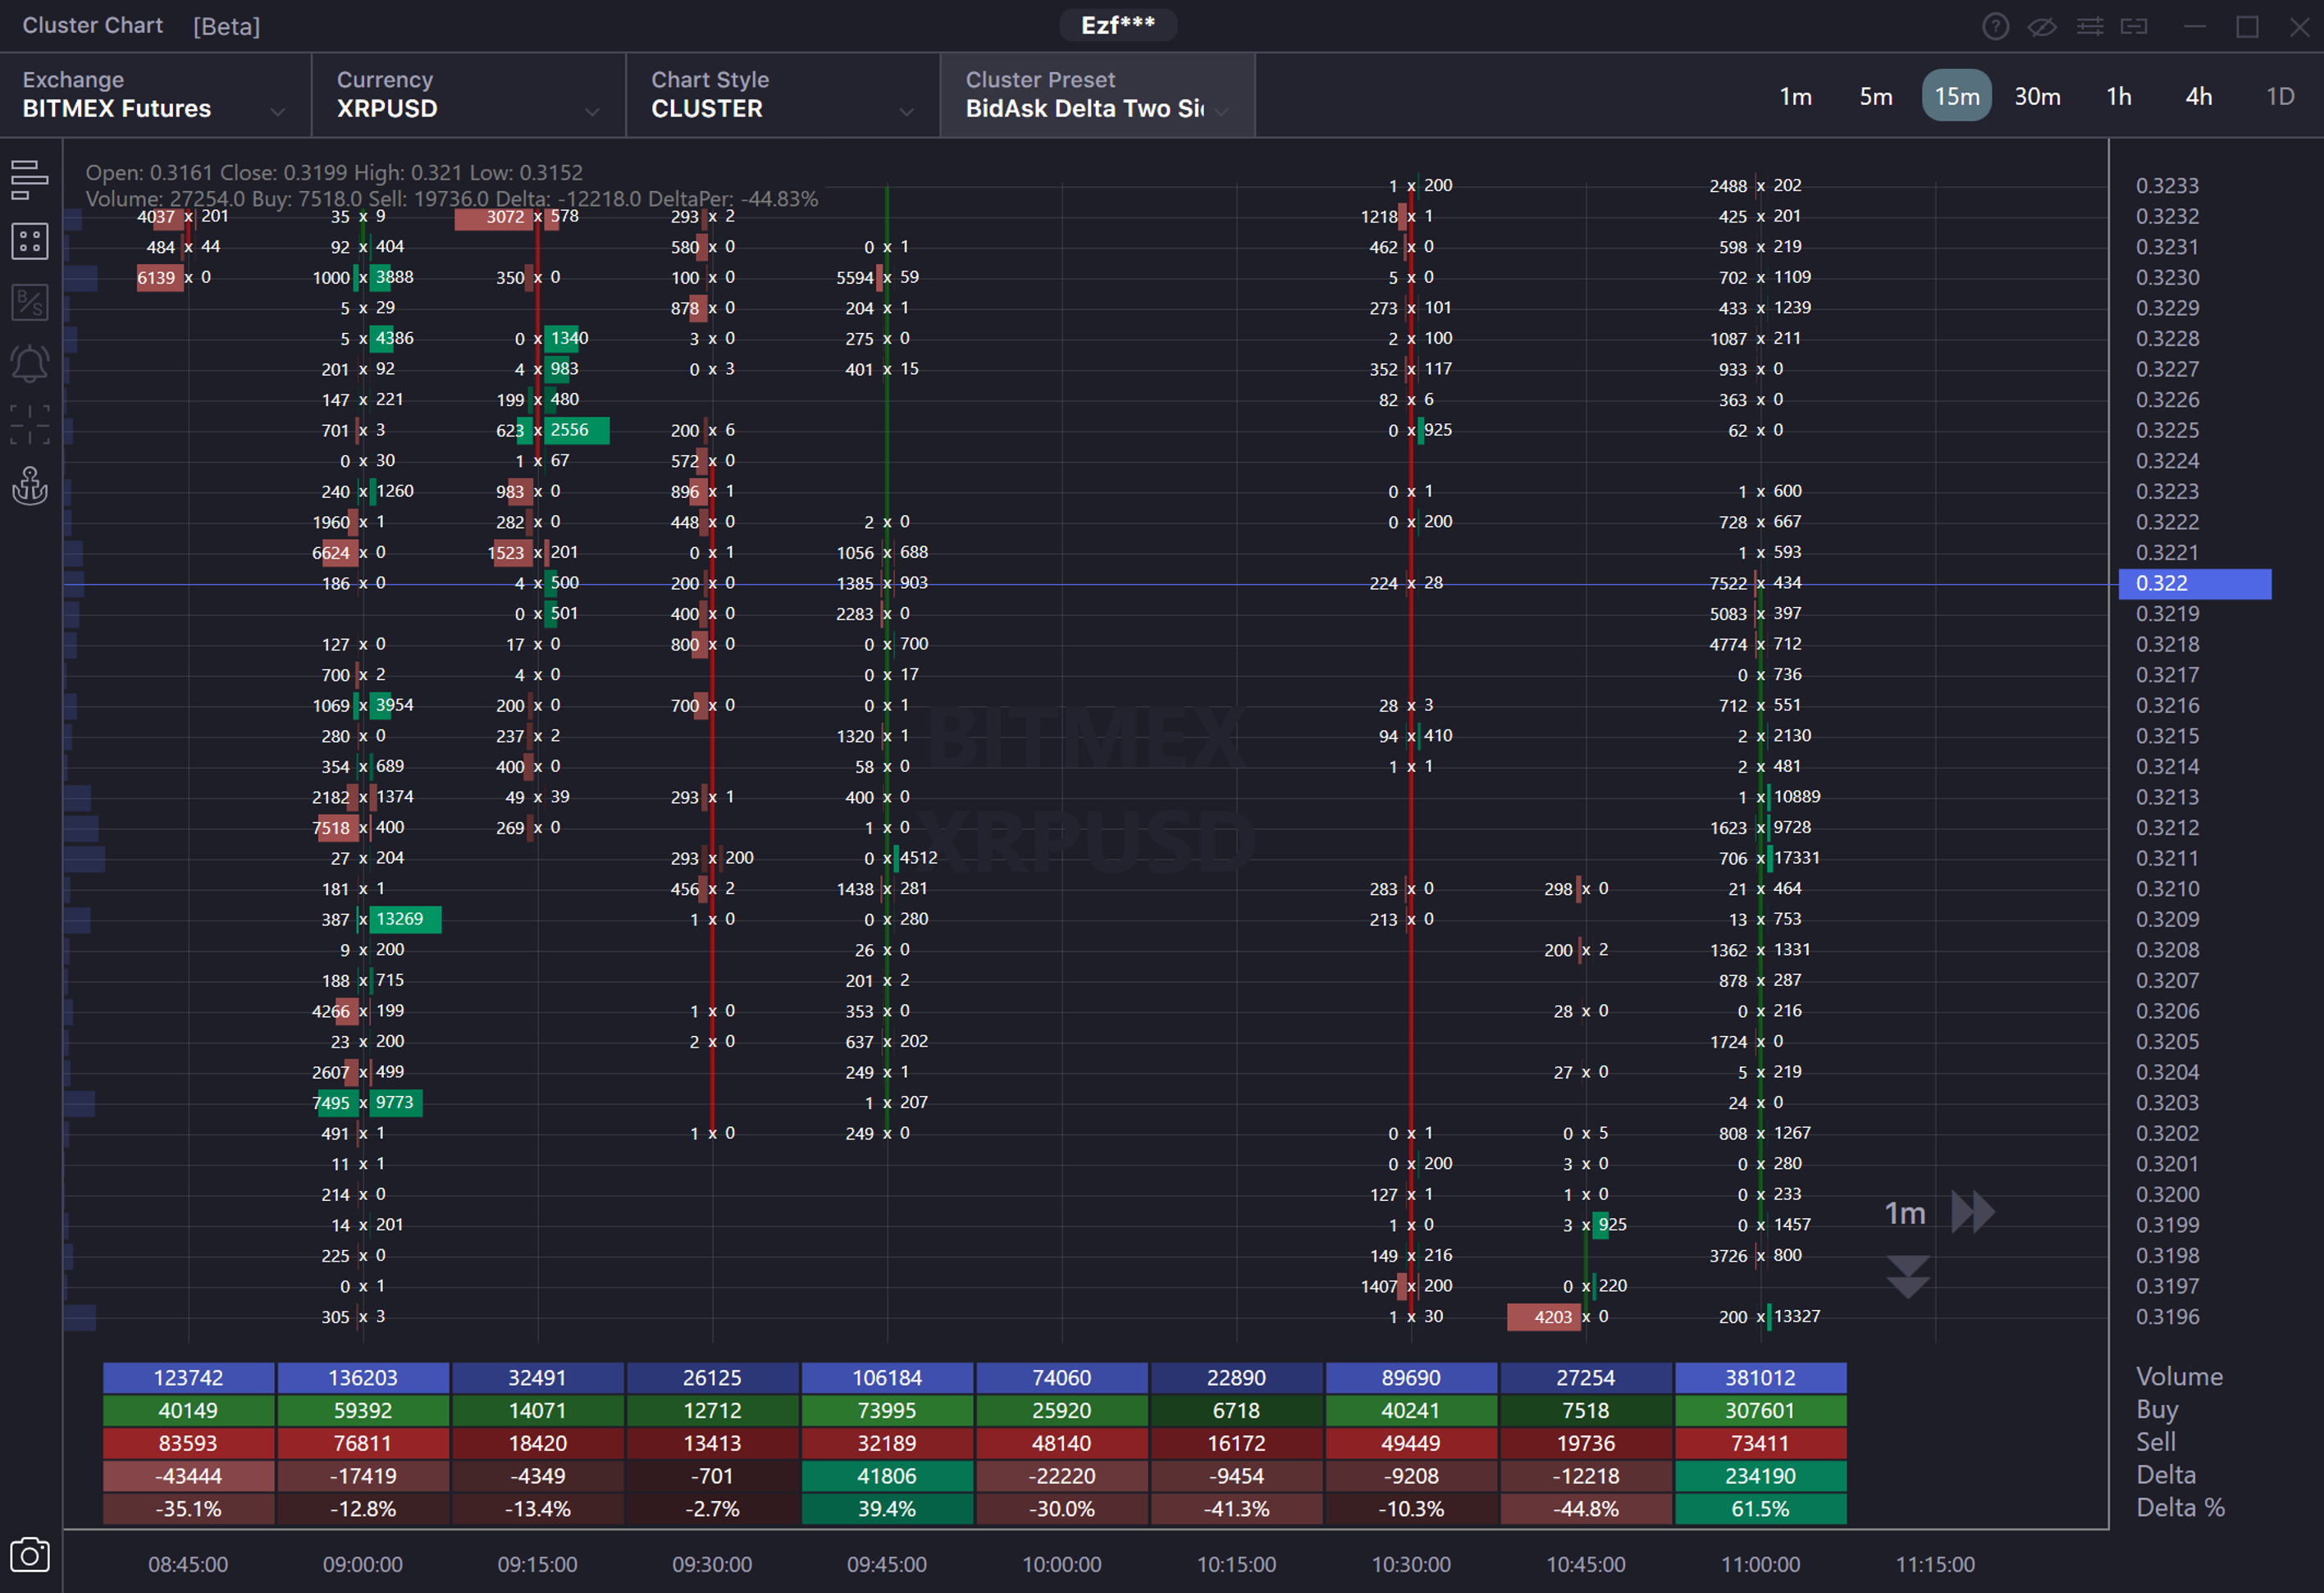
BidAsk Delta two side histogram two Gradient -The cluster shows two values - the traded volume in Bid ( sells) and the traded volume in Ask ( buys) by price over the time frame. The data displays by a two-sided histogram of different lengths. Histograms of traded volume in Bid (sells) at the selected price over the time frame are displayed on the left. The histogram length depends on the total selling at a price over the time frame. On the right, you can see the histograms of the trading volume in Ask (Buy) at the selected price over the time frame. The length of the histogram depends on the total buy volume at a price over the period. If the volume of buys was higher than the volume of sells at a price for the period, then both histograms will be colored in green. If the selling volume was more than the buying volume, then it will be red. Both histograms with the maximum absolute value of the positive or negative delta deviation over the period will be the brightest and non-transparent.
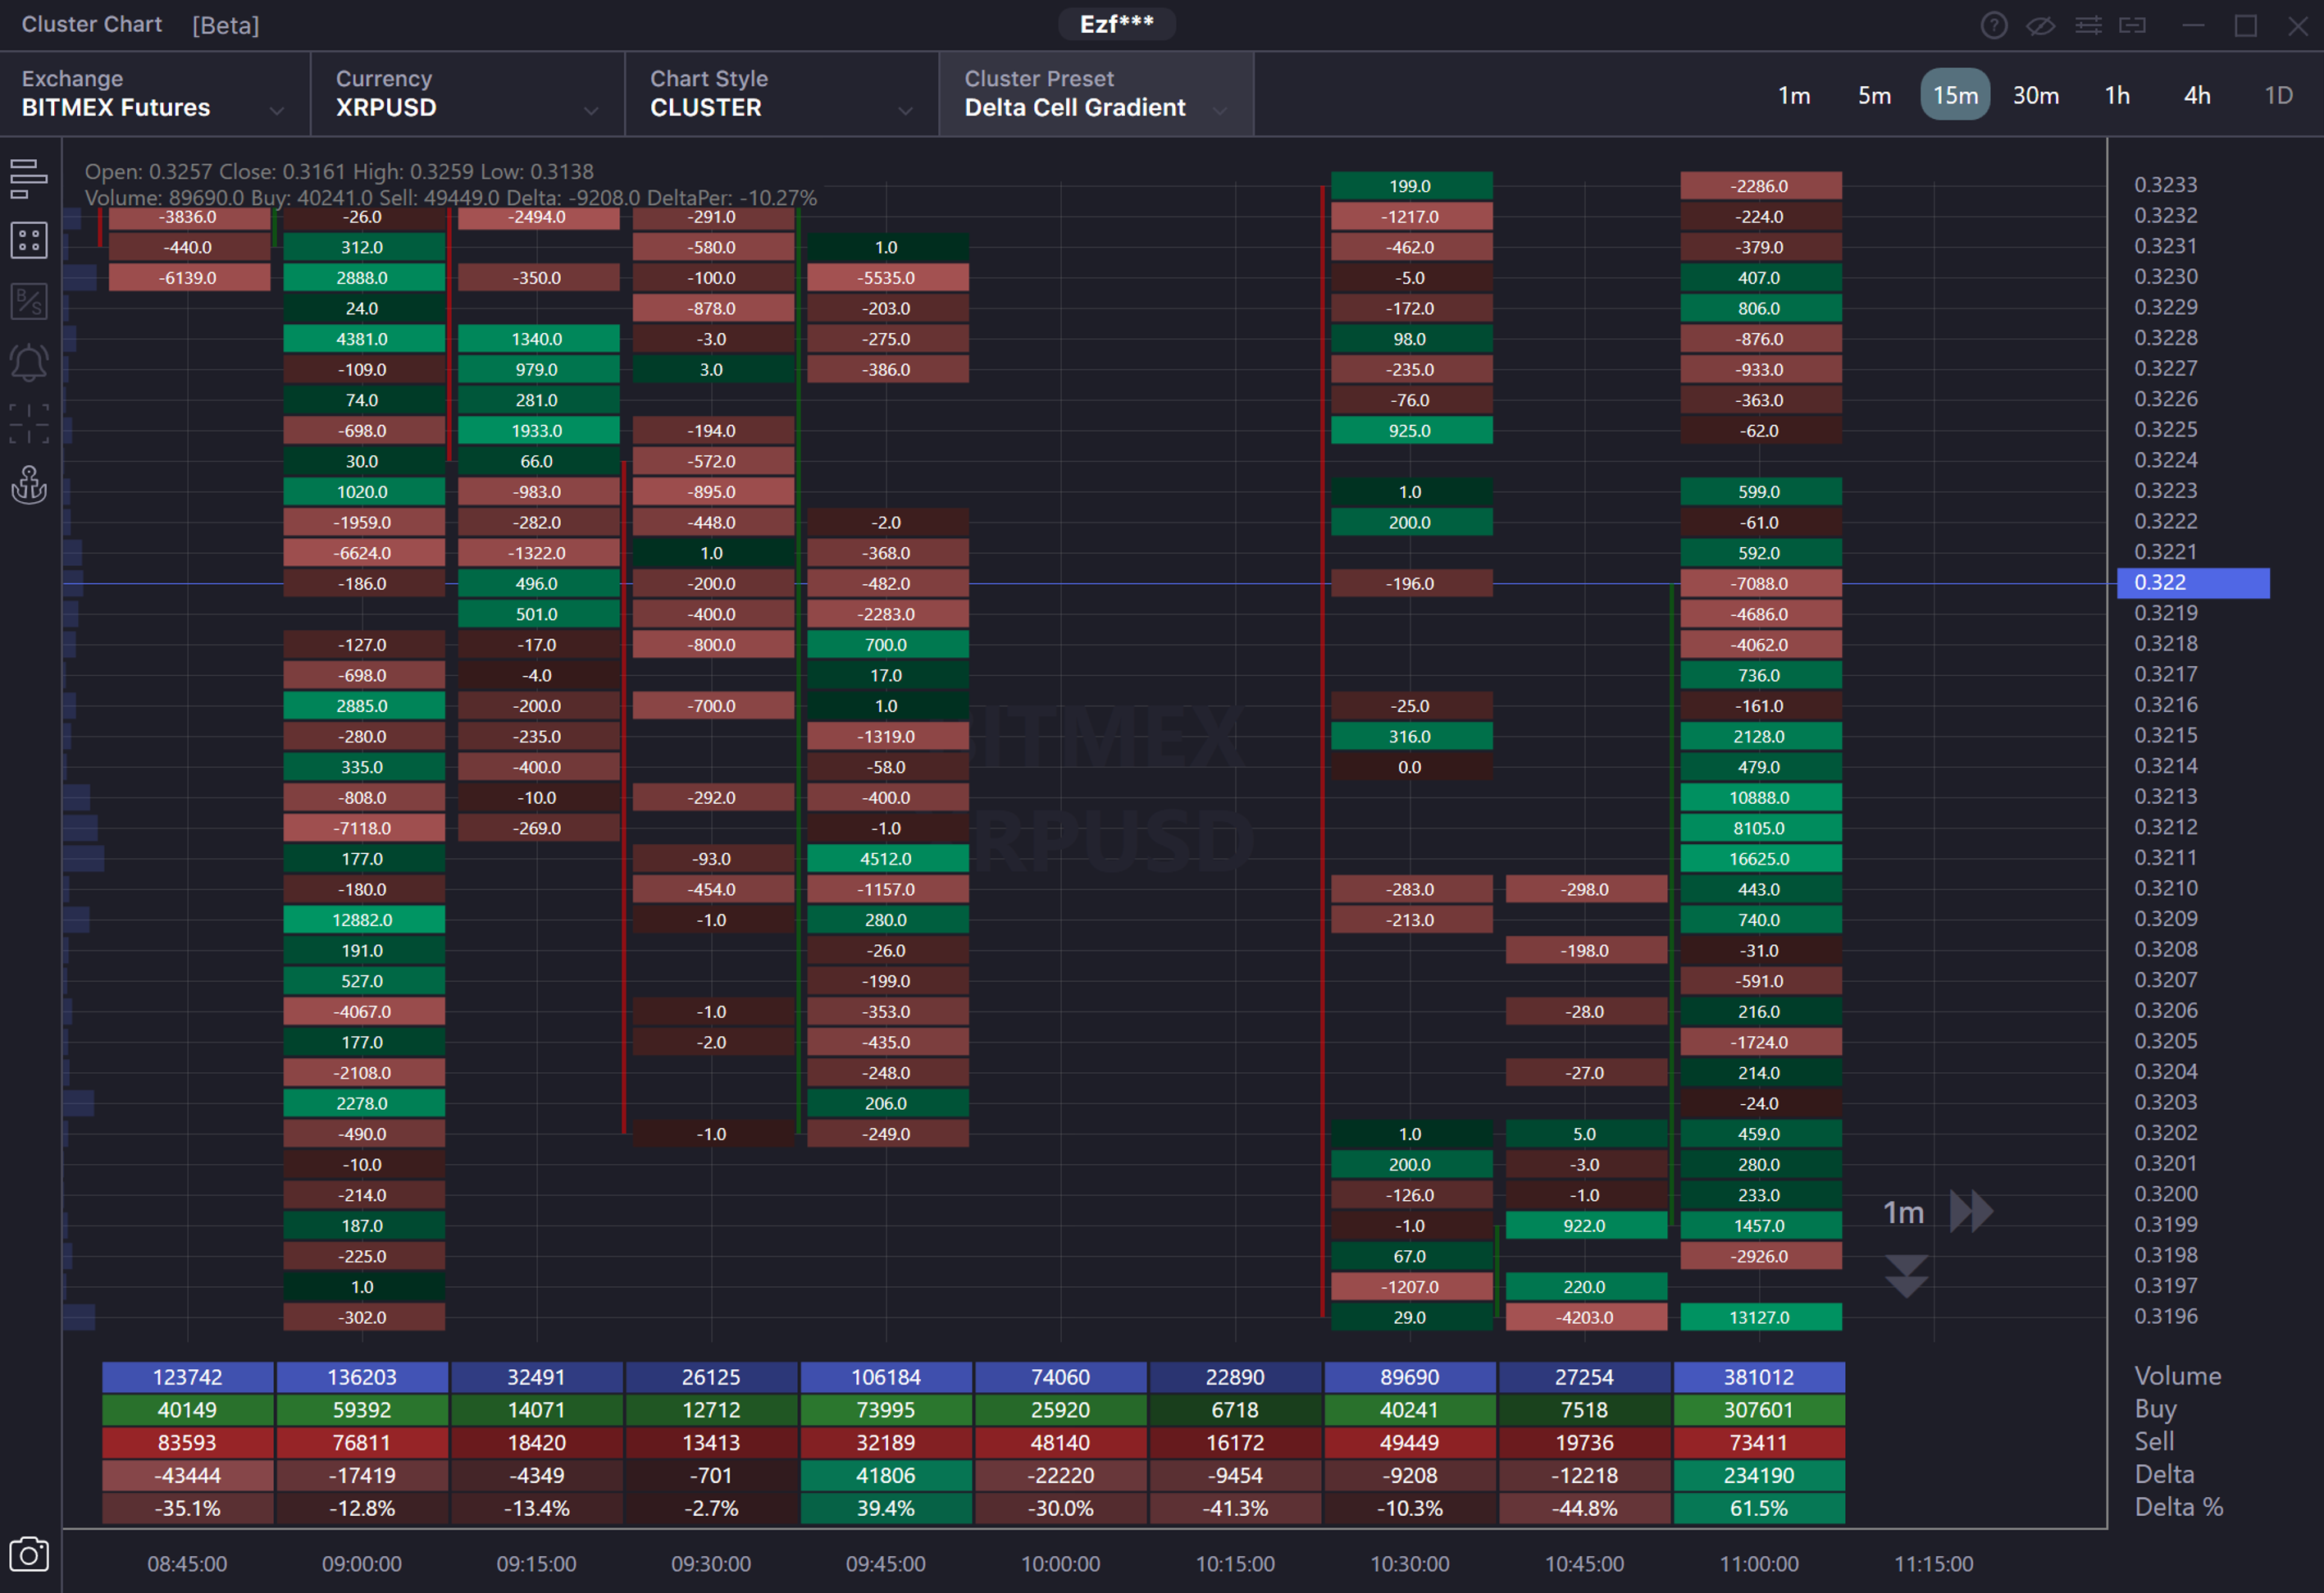
Delta Cell Gradient - The cluster shows the delta of the difference between total selling and buying volume by price over the time frame (Buying volume minus selling volume). If the value is positive, then the volume of buys exceeds the volume of sells at a price for the selected period. The value is negative when the volume of sales is higher than the buying volume. The data is displayed in cells colored in separate colors, with different levels of brightness and transparency. Cells with a sales predominance (negative delta) have a red shade, cells with a high prevalence of buying (positive delta) have a green shade. Cells with the maximum value of positive and negative delta over the time frame will be the brightest.
Delta one side Histogram Gradient - The cluster shows the difference in the delta between total sales and buys at a price over the time frame (Buying volume minus selling volume). If the value is positive, then the volume of buys is higher than the volume of sells at a price over the selected time frame. If the value is negative, then the selling volume is higher than the volume of buys. The data in histograms have different lengths, painted in various colors with different levels of brightness and transparency. Histograms with a sales domination (negative delta) have a red coloring. Histograms with a buying domination (positive delta) are colored in green.Histograms will be the longest, brightest and nontransparent with the maximum absolute value of the positive or negative delta deviation over the time frame.
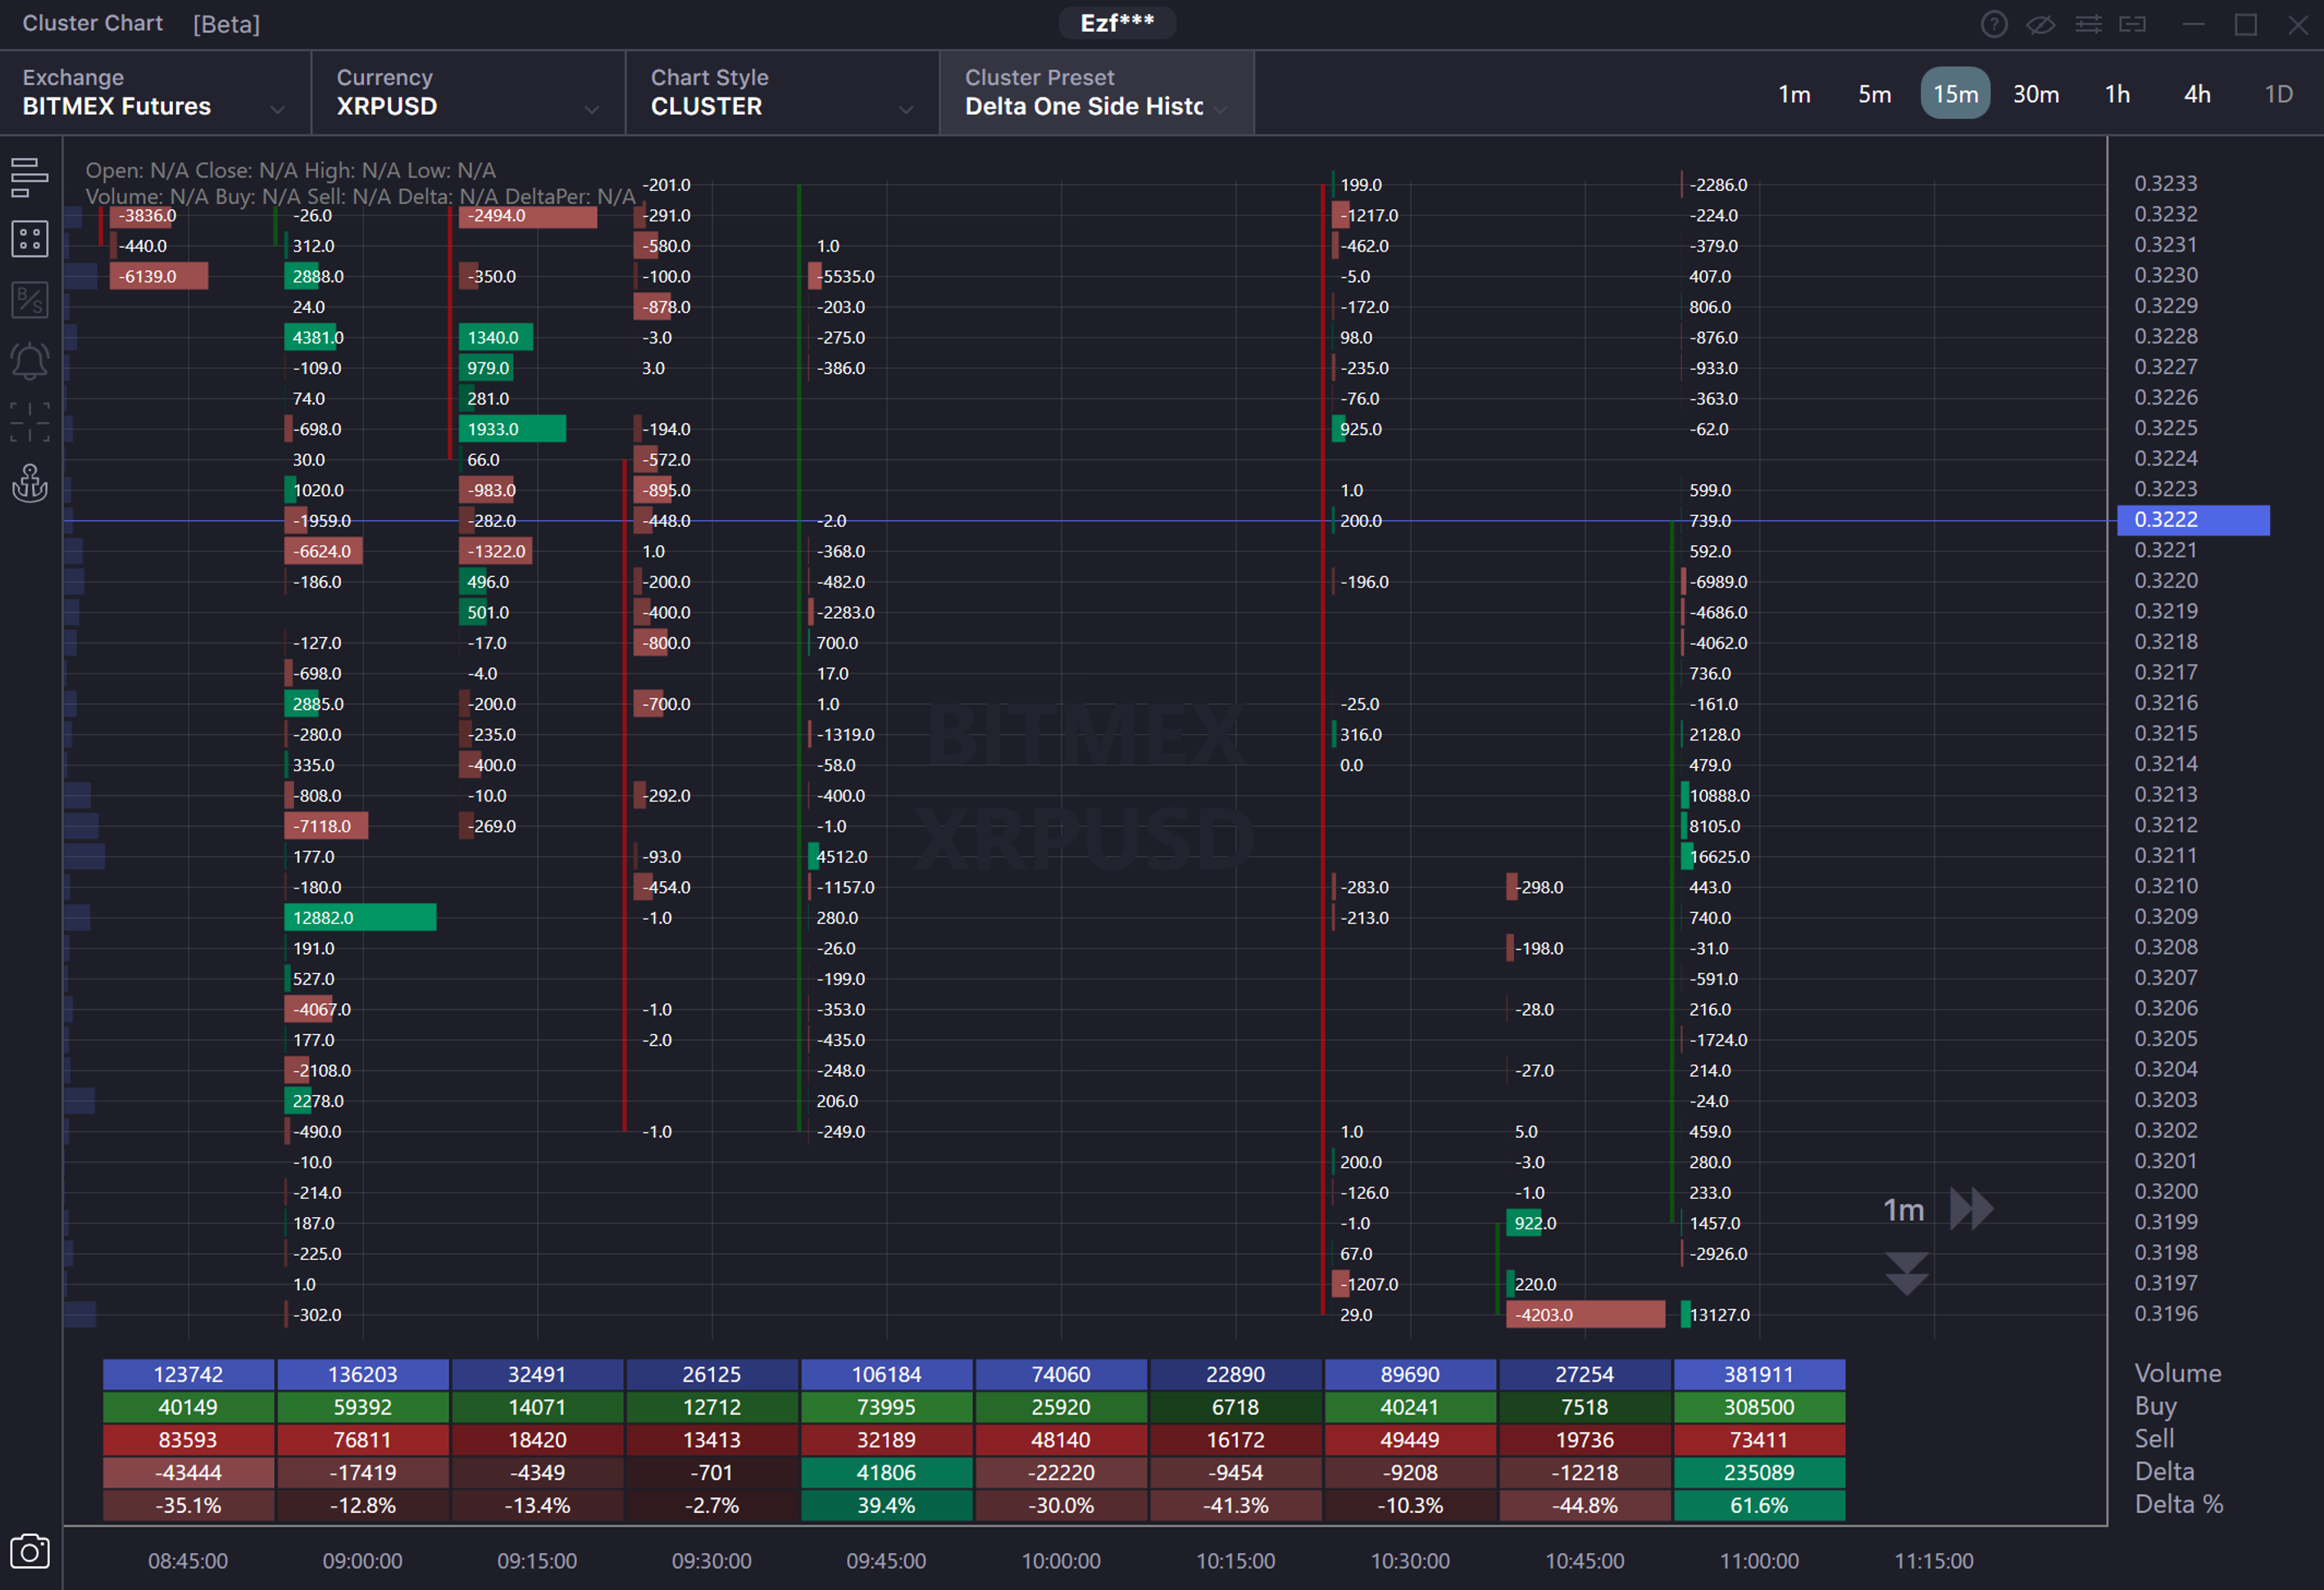
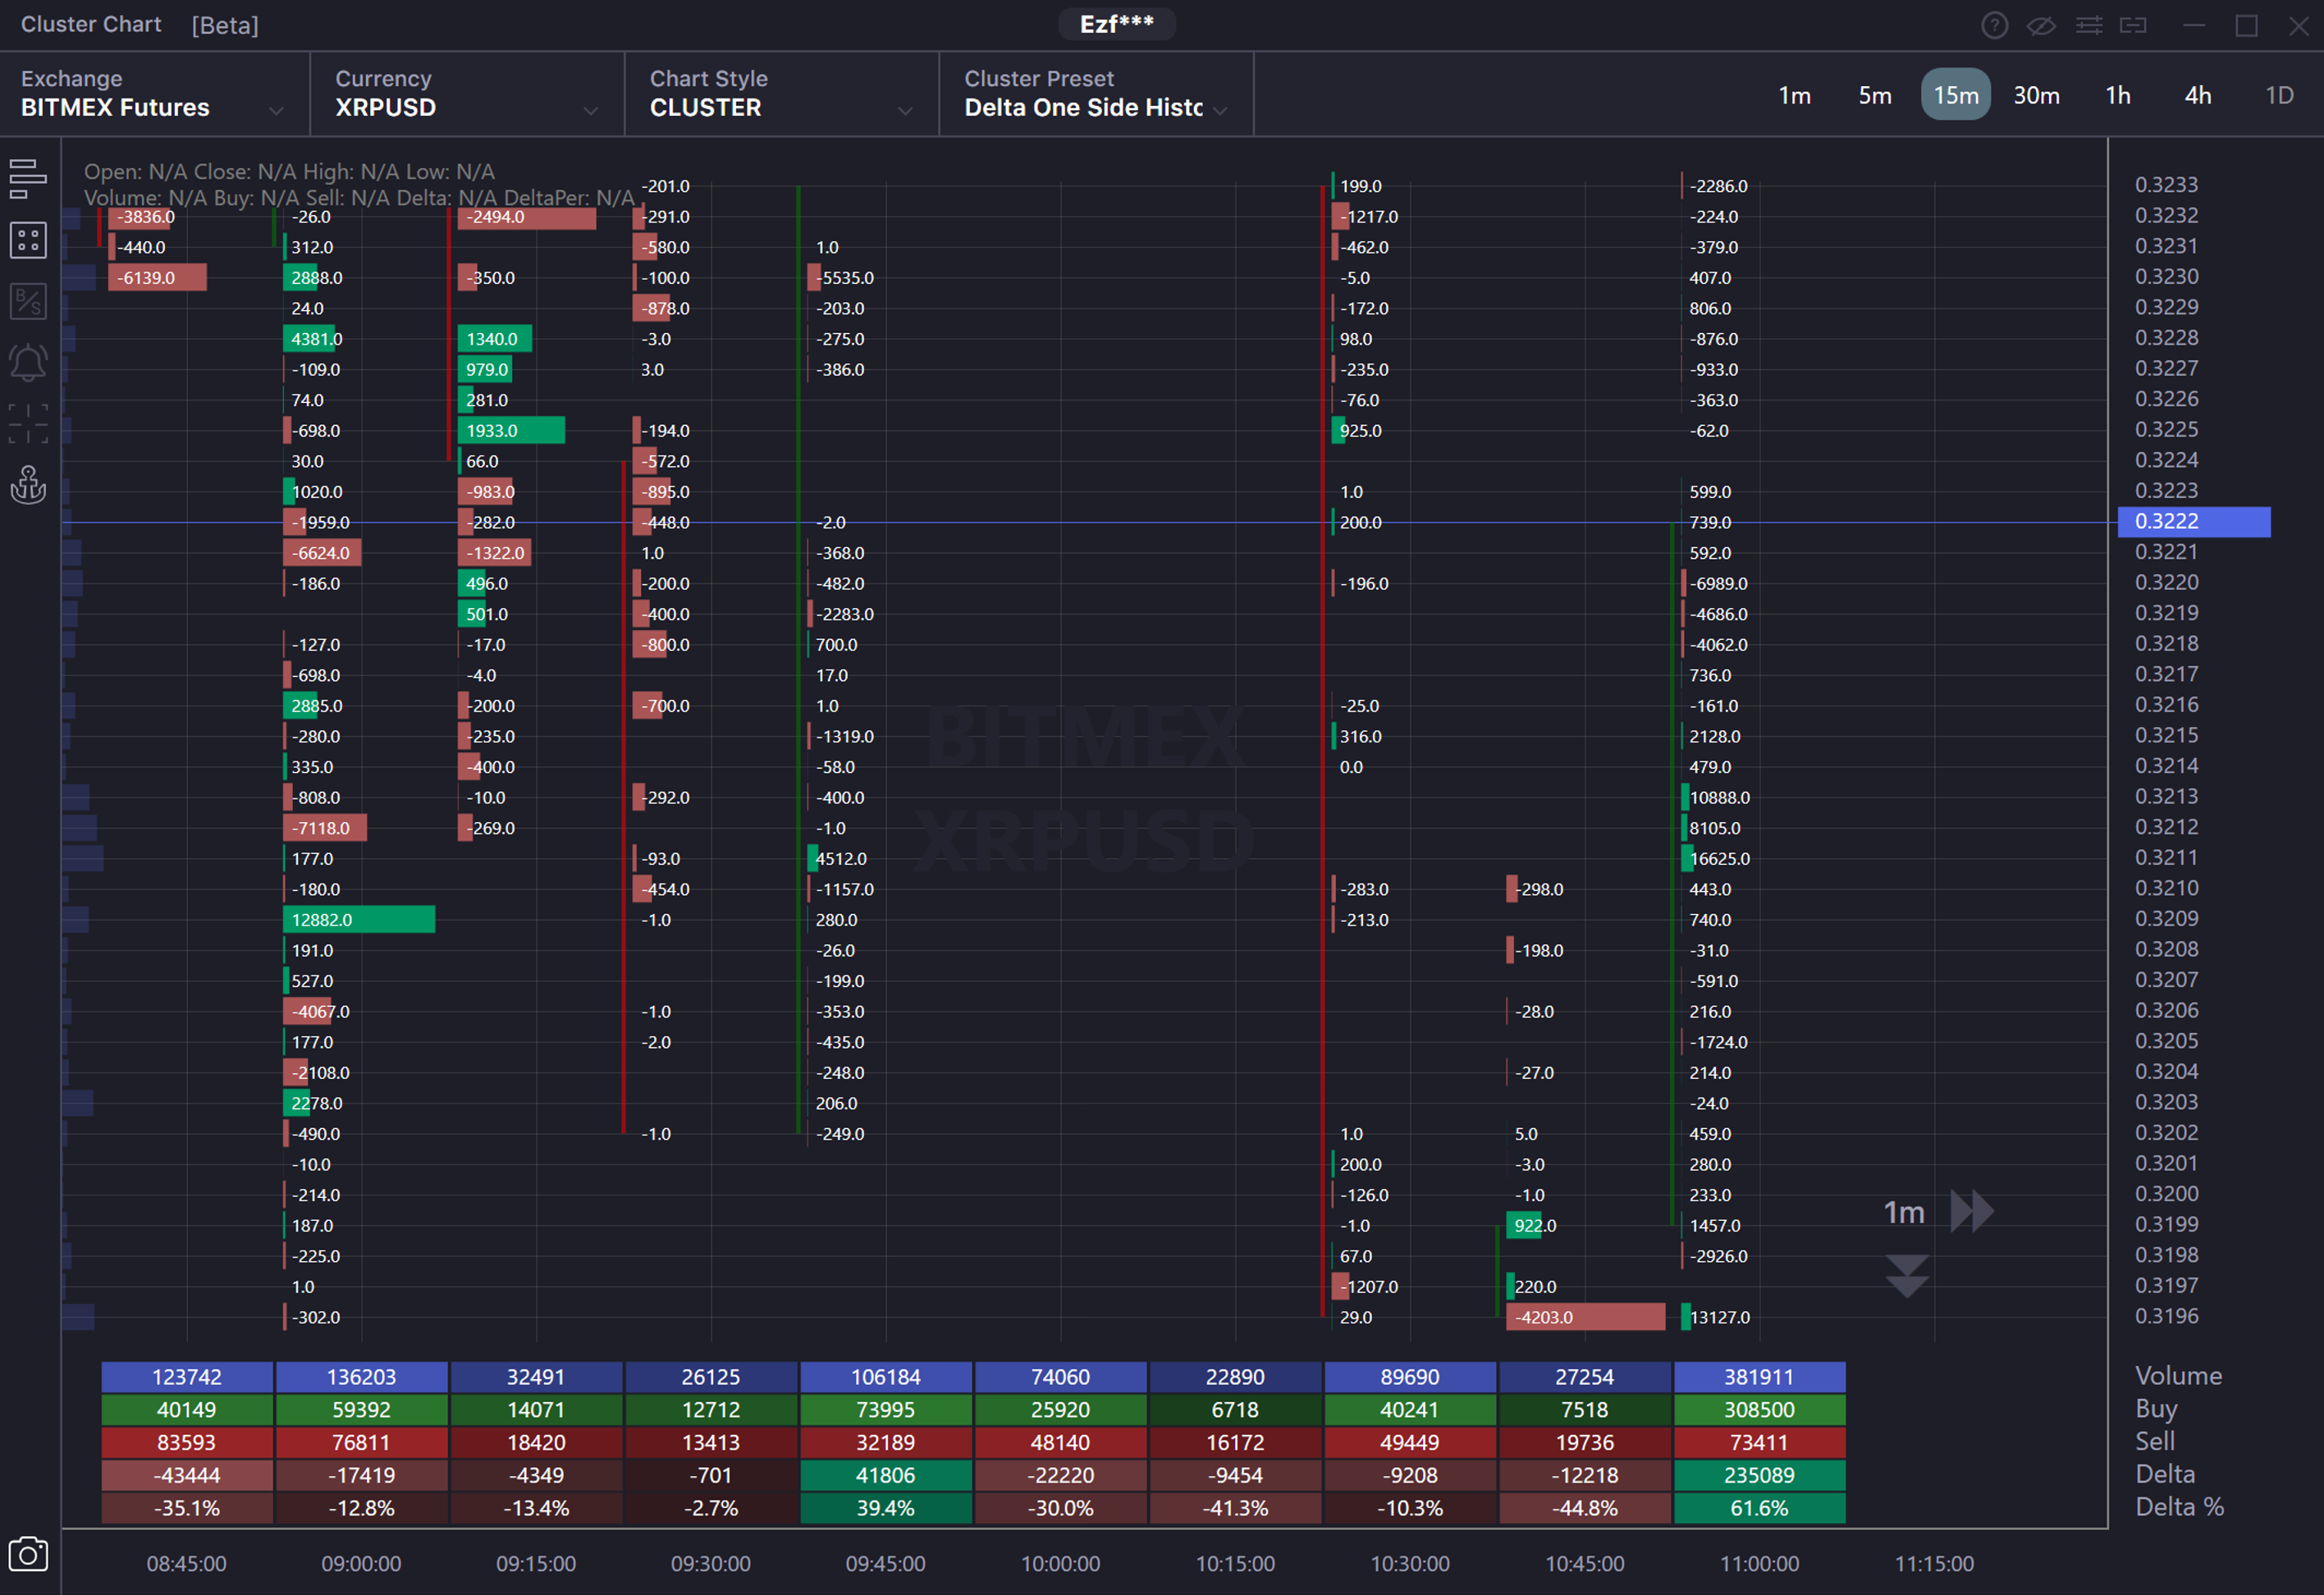
Delta one side Histogram two color - The cluster displays the delta difference between the total volume of sell and buys orders at a price over a time frame (volume of buy minus volume of sell orders). If the value is positive, then the volume of buys is higher than the volume of sells at a price over the selected period. If the value is negative, then the selling volume is higher than the buying volume. Histograms of different lengths and colors display the data. Histograms with a predominance of sells (negative delta) have a red coloring. Those histograms, with the predominance of buys (positive delta), have a green coloring. The longest histograms will be with the maximum absolute value of the deviation of the positive or negative delta over the time frame.