#
Main. Order Book Heatmap
The SKARB Order Book Heatmap is a kind of transparency of market actions. By observing these actions in real-time, you can predict their impact on the market in the short term. The Order Book Heatmap visualizes limit orders and spreads dynamics. In other words, by analyzing price movements, you can get a deeper perception of buyers' and sellers' behavior.
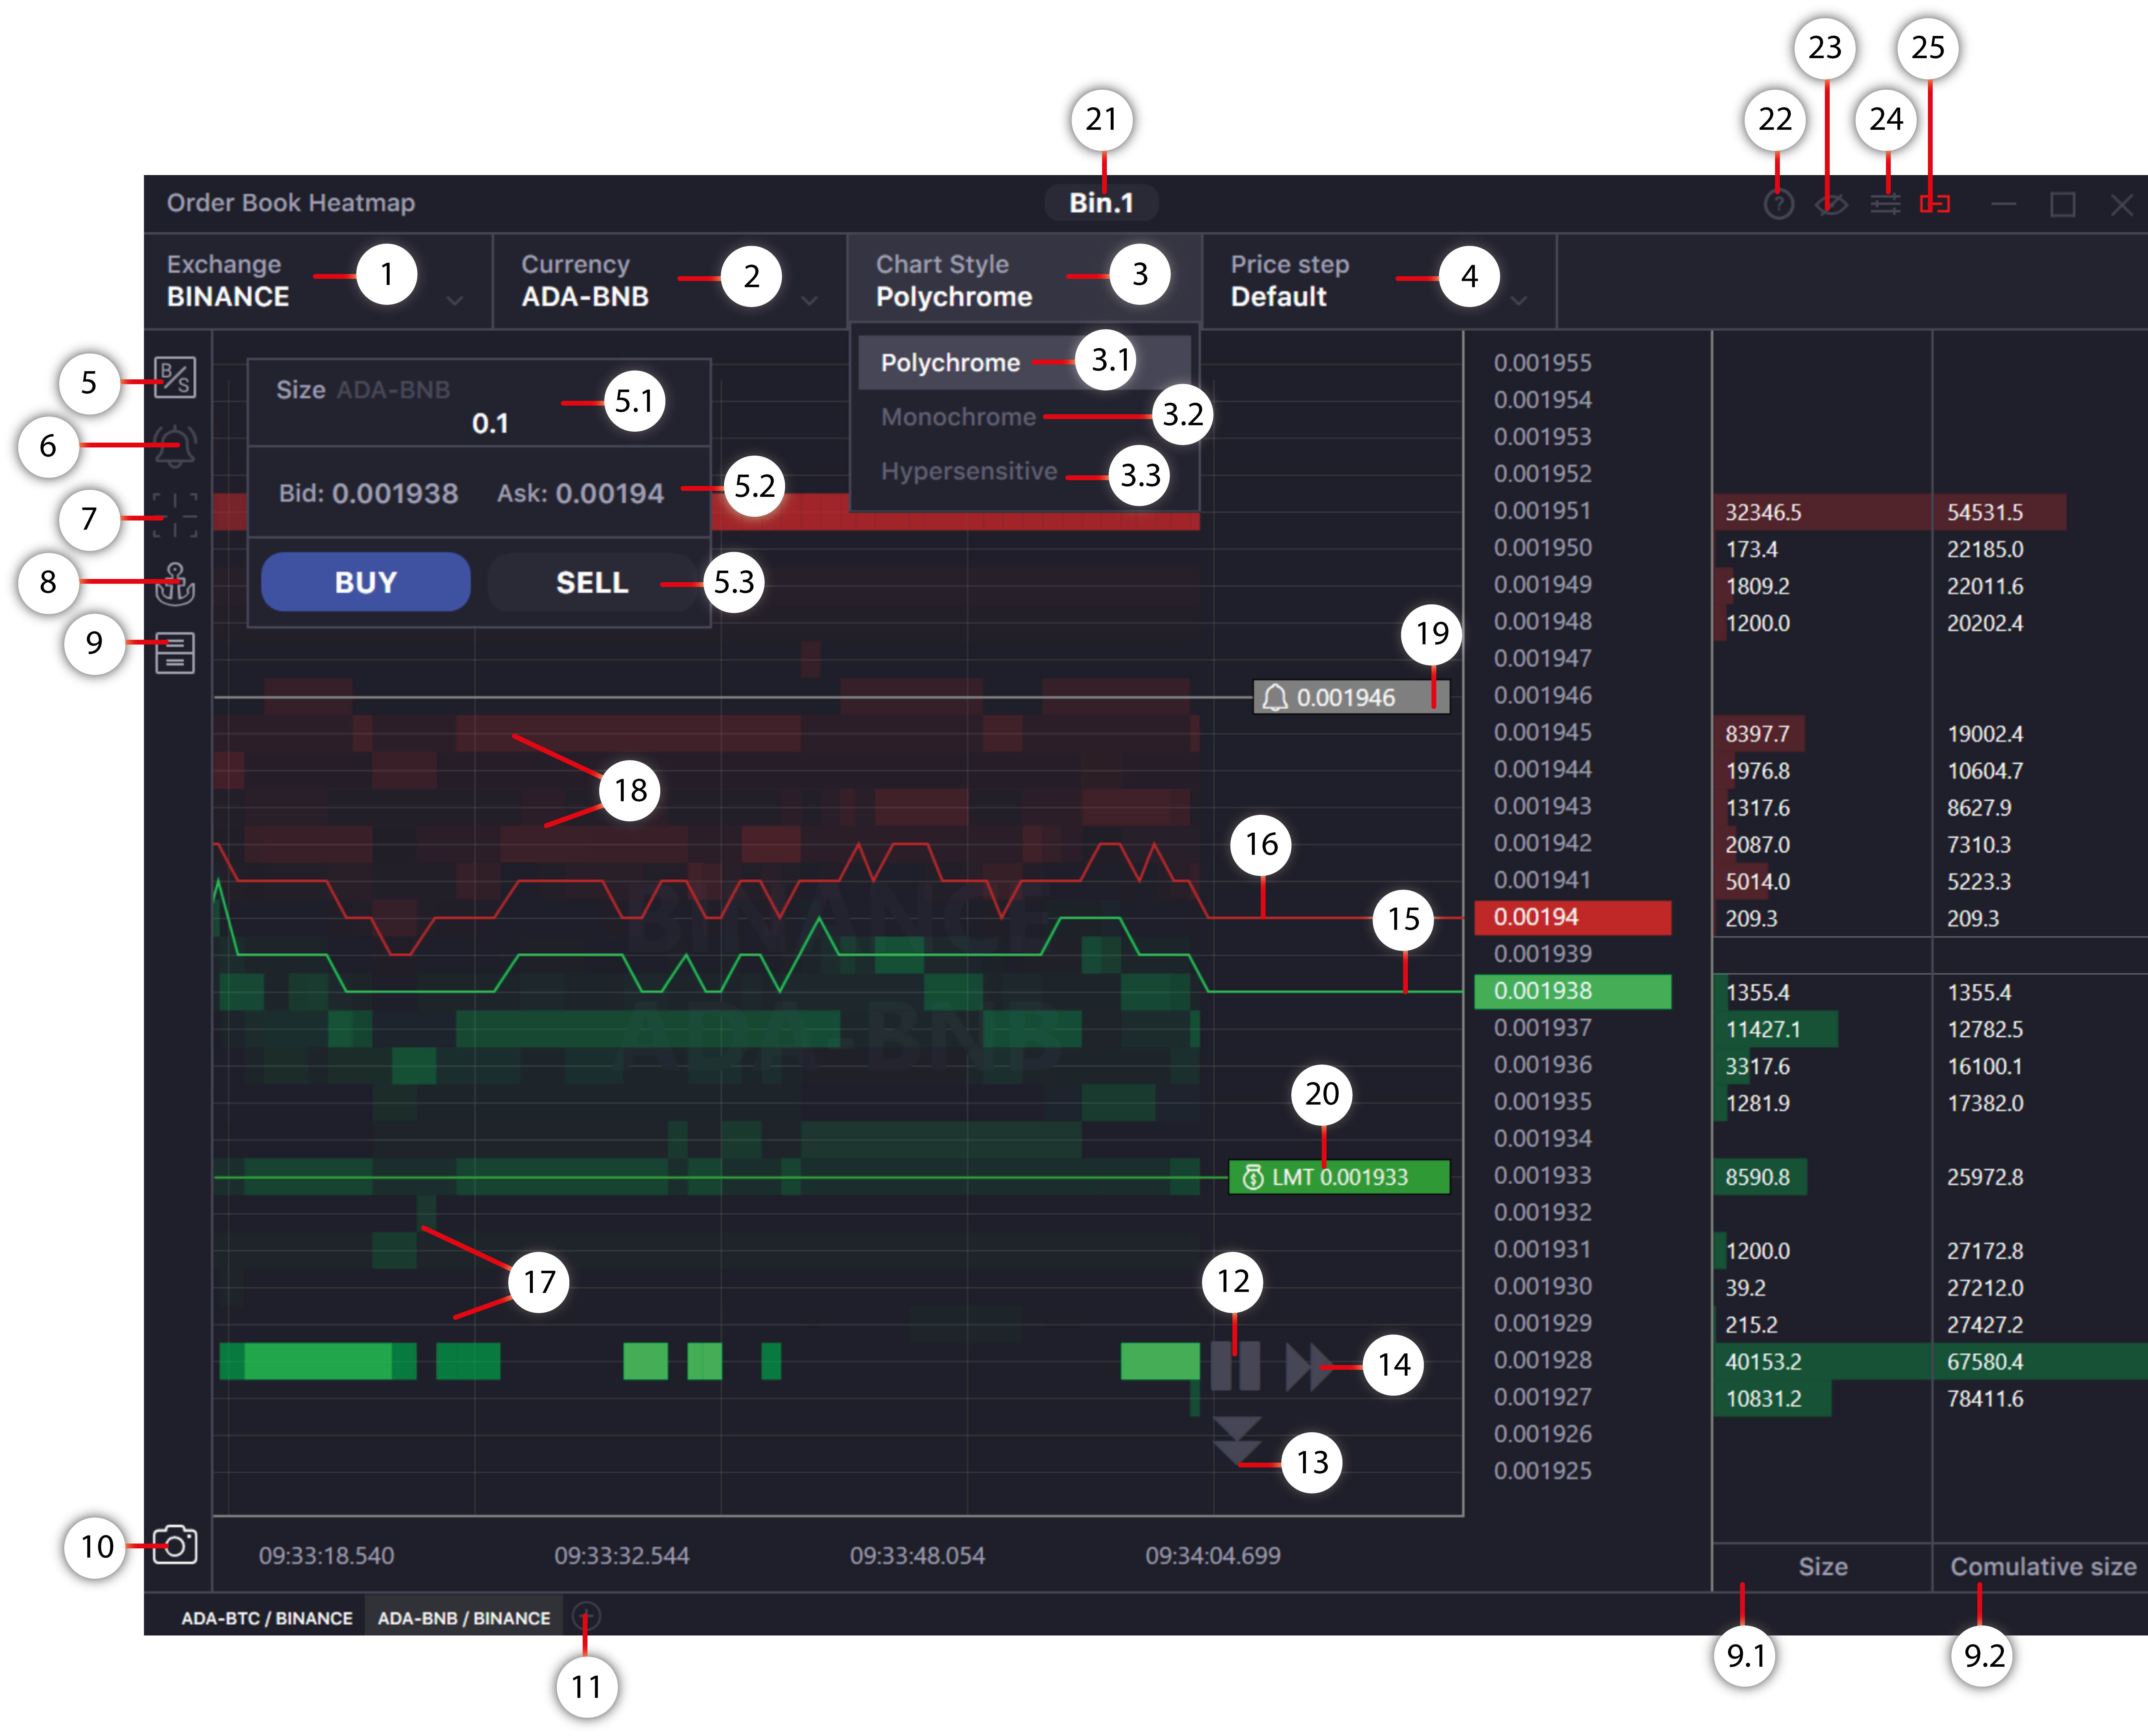
- Exchange selection field. You can select both spot and futures exchanges. Exchanges with extremely small price increments for trading instruments (Bitfinex, Bittrex) may have a less informative Order Book Activity Chart.
- Select a trading instrument here.
- A field for selecting the chart style. 3.1. Polychrome chart style. When this style is selected, buy order activity bands are colored green and its shades, and sell order activity bands are colored red and its shades. The brighter the band - the bigger the cumulative size of the bids. 3.2. Monochrome chart style. By selecting this style, activity bands for both buy and sell orders will be colored in gray color and its shades. The brighter the band, the bigger the cumulative size of the bids. 3.3. Hypersensitive chart style. When this style is selected, ONLY the best bid and the best ask price bands are displayed. The data flow for this chart style is more accurate and shows all price changes. The activity bands of cumulative buy orders and sell orders will not be displayed. Use this style for a precise analysis of changes in trading asset spreads.
- You can sort Order Book entries by price range. When the filter is enabled, the orders are grouped according to the Price Step value set by the user. The grouped sizes of the order book entries are summarized and displayed on the price levels of the selected Price Step range.
- You can sort Order Book entries by price range. When the filter is enabled, the orders are grouped according to the Price Step value set by the user. The grouped sizes of the order book entries are summarized and displayed on the price levels of the selected Price Step range. 5.1. Input field for the amount of the base currency in the orders for SPOT and the number of contracts for Contracts 5.2. The current prices for the Best Buy and Best Sell orders. 5.3. Buttons for quick trading from the chart (Buy/Long and Sell/Short). When using the Maker Button Strategy, the first button will be Buy/Long. The Limit order will be sent with the Price of the Best Buy order limit (you will add liquidity to the order book, and your order may not execute immediately, but you will save exchange commission). The second button will be Sell/Short, and the Limit order will be sent with the Price of the best Sell order limit (you will add liquidity to the order book). When using the Taker Button Strategy, the first will be a Sell/Short button, and the Limit Order will be sent with the Best Buy Order Limit Price (you will take liquidity from the order book with instant order execution but with a higher exchange commission). The second will be a Buy/Long button, and the Limit Order will be sent with the Best Sell Order Limit Price (you will take liquidity from the order book)
- Activate to display a price alert on the chart. (Click on the icon. Next, on the chart, click opposite the desired price.)
- Click on the icon to activate the Cross on the chart (in the settings, you can change the crosshair style to "horizontal line only" or "vertical line only").
- Activate to "anchor" the best buy and sell order price lines in the visible area of the chart. When the button is enabled, the order book activity chart is drawing in the visible zone. If prices move outside the visible area, the chart automatically aligned according to the center of the price scale.
- Activate to display a vertically arranged order book. 9.1. The vertical order book column showing the size of the orders (Size). 9.2. Vertical Order Book column showing the accumulated order sizes at each price (Cumulative Size).
- Button to screenshot the chart. By clicking on the button, a screenshot of the chart appears on the clipboard. Now you can share the screenshot or save it for further analysis.
- The button to create additional tabs with trading instruments in one window, for quick switching between different exchanges and trading instruments. A tab is removed by rightclicking on it.
- The Start/Stop button of the Order Book Heatmap. After you click on Stop, the data in the window will stop updating and, you can rewind the map to see historical data changes. By clicking on Start, the heatmap starts updating again.
- Reset zoom button to the standard position at the vertical price scale (Y-axis).
- Reset zoom button to the standard position at the horizontal time scale (X-axis).
- The line displaying changes in the price of the best buy offer in real-time (best Bid).
- The line displaying changes in the price of the best sell offer in real-time (best Ask).
- The band shows the size of the buy orders at a specific price in the Order Book. The brighter the band in the Order Book, the greater the total amount of placed orders at the selected price relative to other orders. Therefore, the pale band in the Order Book means the smaller sum of order sizes at the selected price. For example, 1000 lots are placed in the Order Book at price 1, and 100 lots are placed at price 2. The band at price 1 will have bright and intense color, and at price 2 - will be dim and pale.
- The band shows the size of the sell orders at a specific price in the Order Book. The brighter the band in the Order Book, the greater the total amount of placed orders at the selected price relative to other orders. Therefore, the pale band in the Order Book means the smaller sum of order sizes at the selected price. For example, 1000 lots are placed in the Order Book at price 1, and 100 lots are placed at price 2. The band at price 1 will have bright and intense color, and at price 2 - will be dim and pale.
- Place a price alert for the selected trading instrument. You can place a price alert directly on the heat map by clicking on the button on the left panel of the window. You can also drag and drop the price alert on the price scale by holding the cursor with the left mouse button. Or you can cancel the price alert by clicking on it with the left mouse button.
- Place a pending order on a selected trading instrument. You can drag the placed order along the price scale by holding down the left mouse button. When you drag an order, the limit price for limit orders changes and the stop price for stop orders (stop limit orders and trigger orders) changes. It is also possible to cancel an order by clicking on it with the right mouse button.
- Button to call the API Management window, to manage the API keys of exchanges and use the MultiApi functionality. (Note 1)
- The Info button allows you to choose and watch PDF manual for Order Book Heatmap.
- This button activates "always on top" mode.
- Button for advanced settings of the Order Book Heatmap window. (Note 2)
- Links the Order Book Heatmap window with other terminal windows. You can change the linking group by сlicking again on the button, or you can leave the button in the neutral position and the window will not be associated with any link group.