#
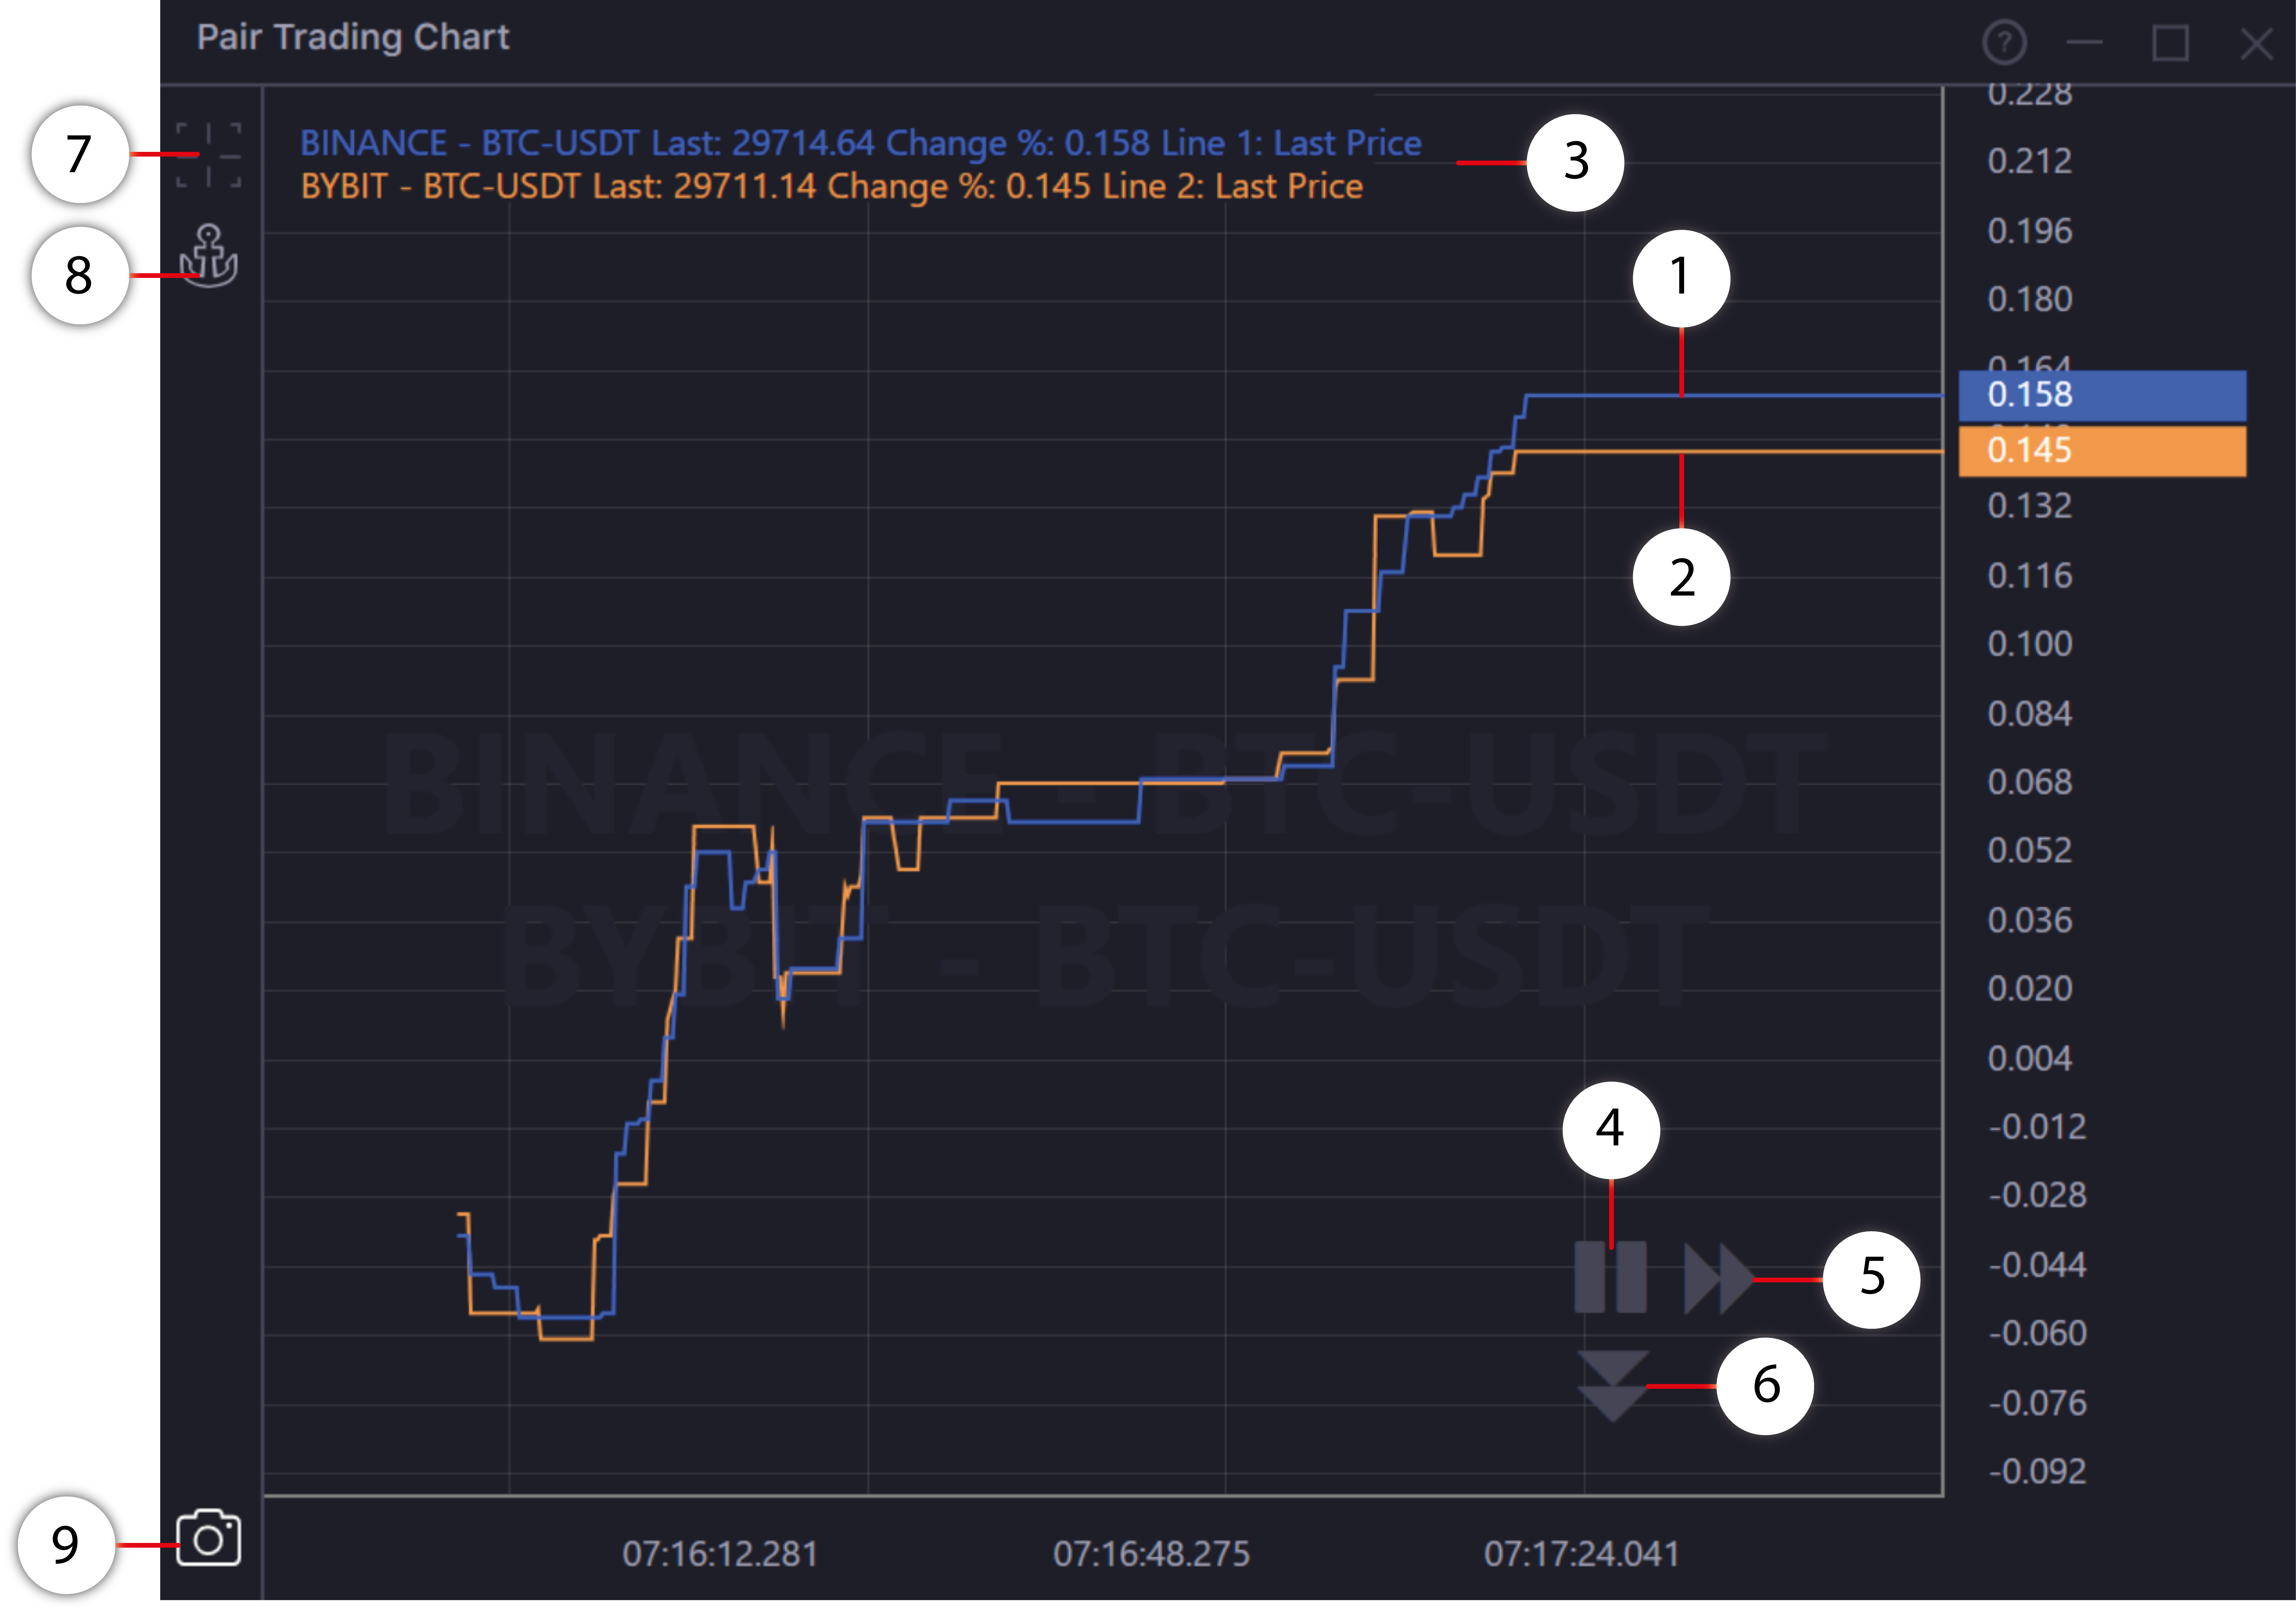
Note 1. Pair Trading Chart

- The line of change in the price of the first asset since the subscription.
- The line of change in the price of the second asset since the subscription.
- A block of current market information for both assets.
- The Start/Stop button of the Pair Trading Chart. After you click on Stop, the data in the window will stop updating and, you can rewind the map to see historical data changes. By clicking on Start, the chart starts updating again.
- Reset zoom button to the standard position at the vertical price scale (X-axis).
- Reset zoom button to the standard position at the horizontal time scale (Y-axis).
- Click on the icon to activate the Cross on the chart.
- Activate to "anchor" the price change lines in the visible area of the chart. When the button is enabled, the pair trading chart is drawing in the visible zone. If prices move outside the visible area, the chart automatically aligned according to the center of the price scale.
- Button to screenshot the chart. By clicking on the button, a screenshot of the chart appears on the clipboard. Now you can share the screenshot or save it for further analysis.