#
Simulated Strategy
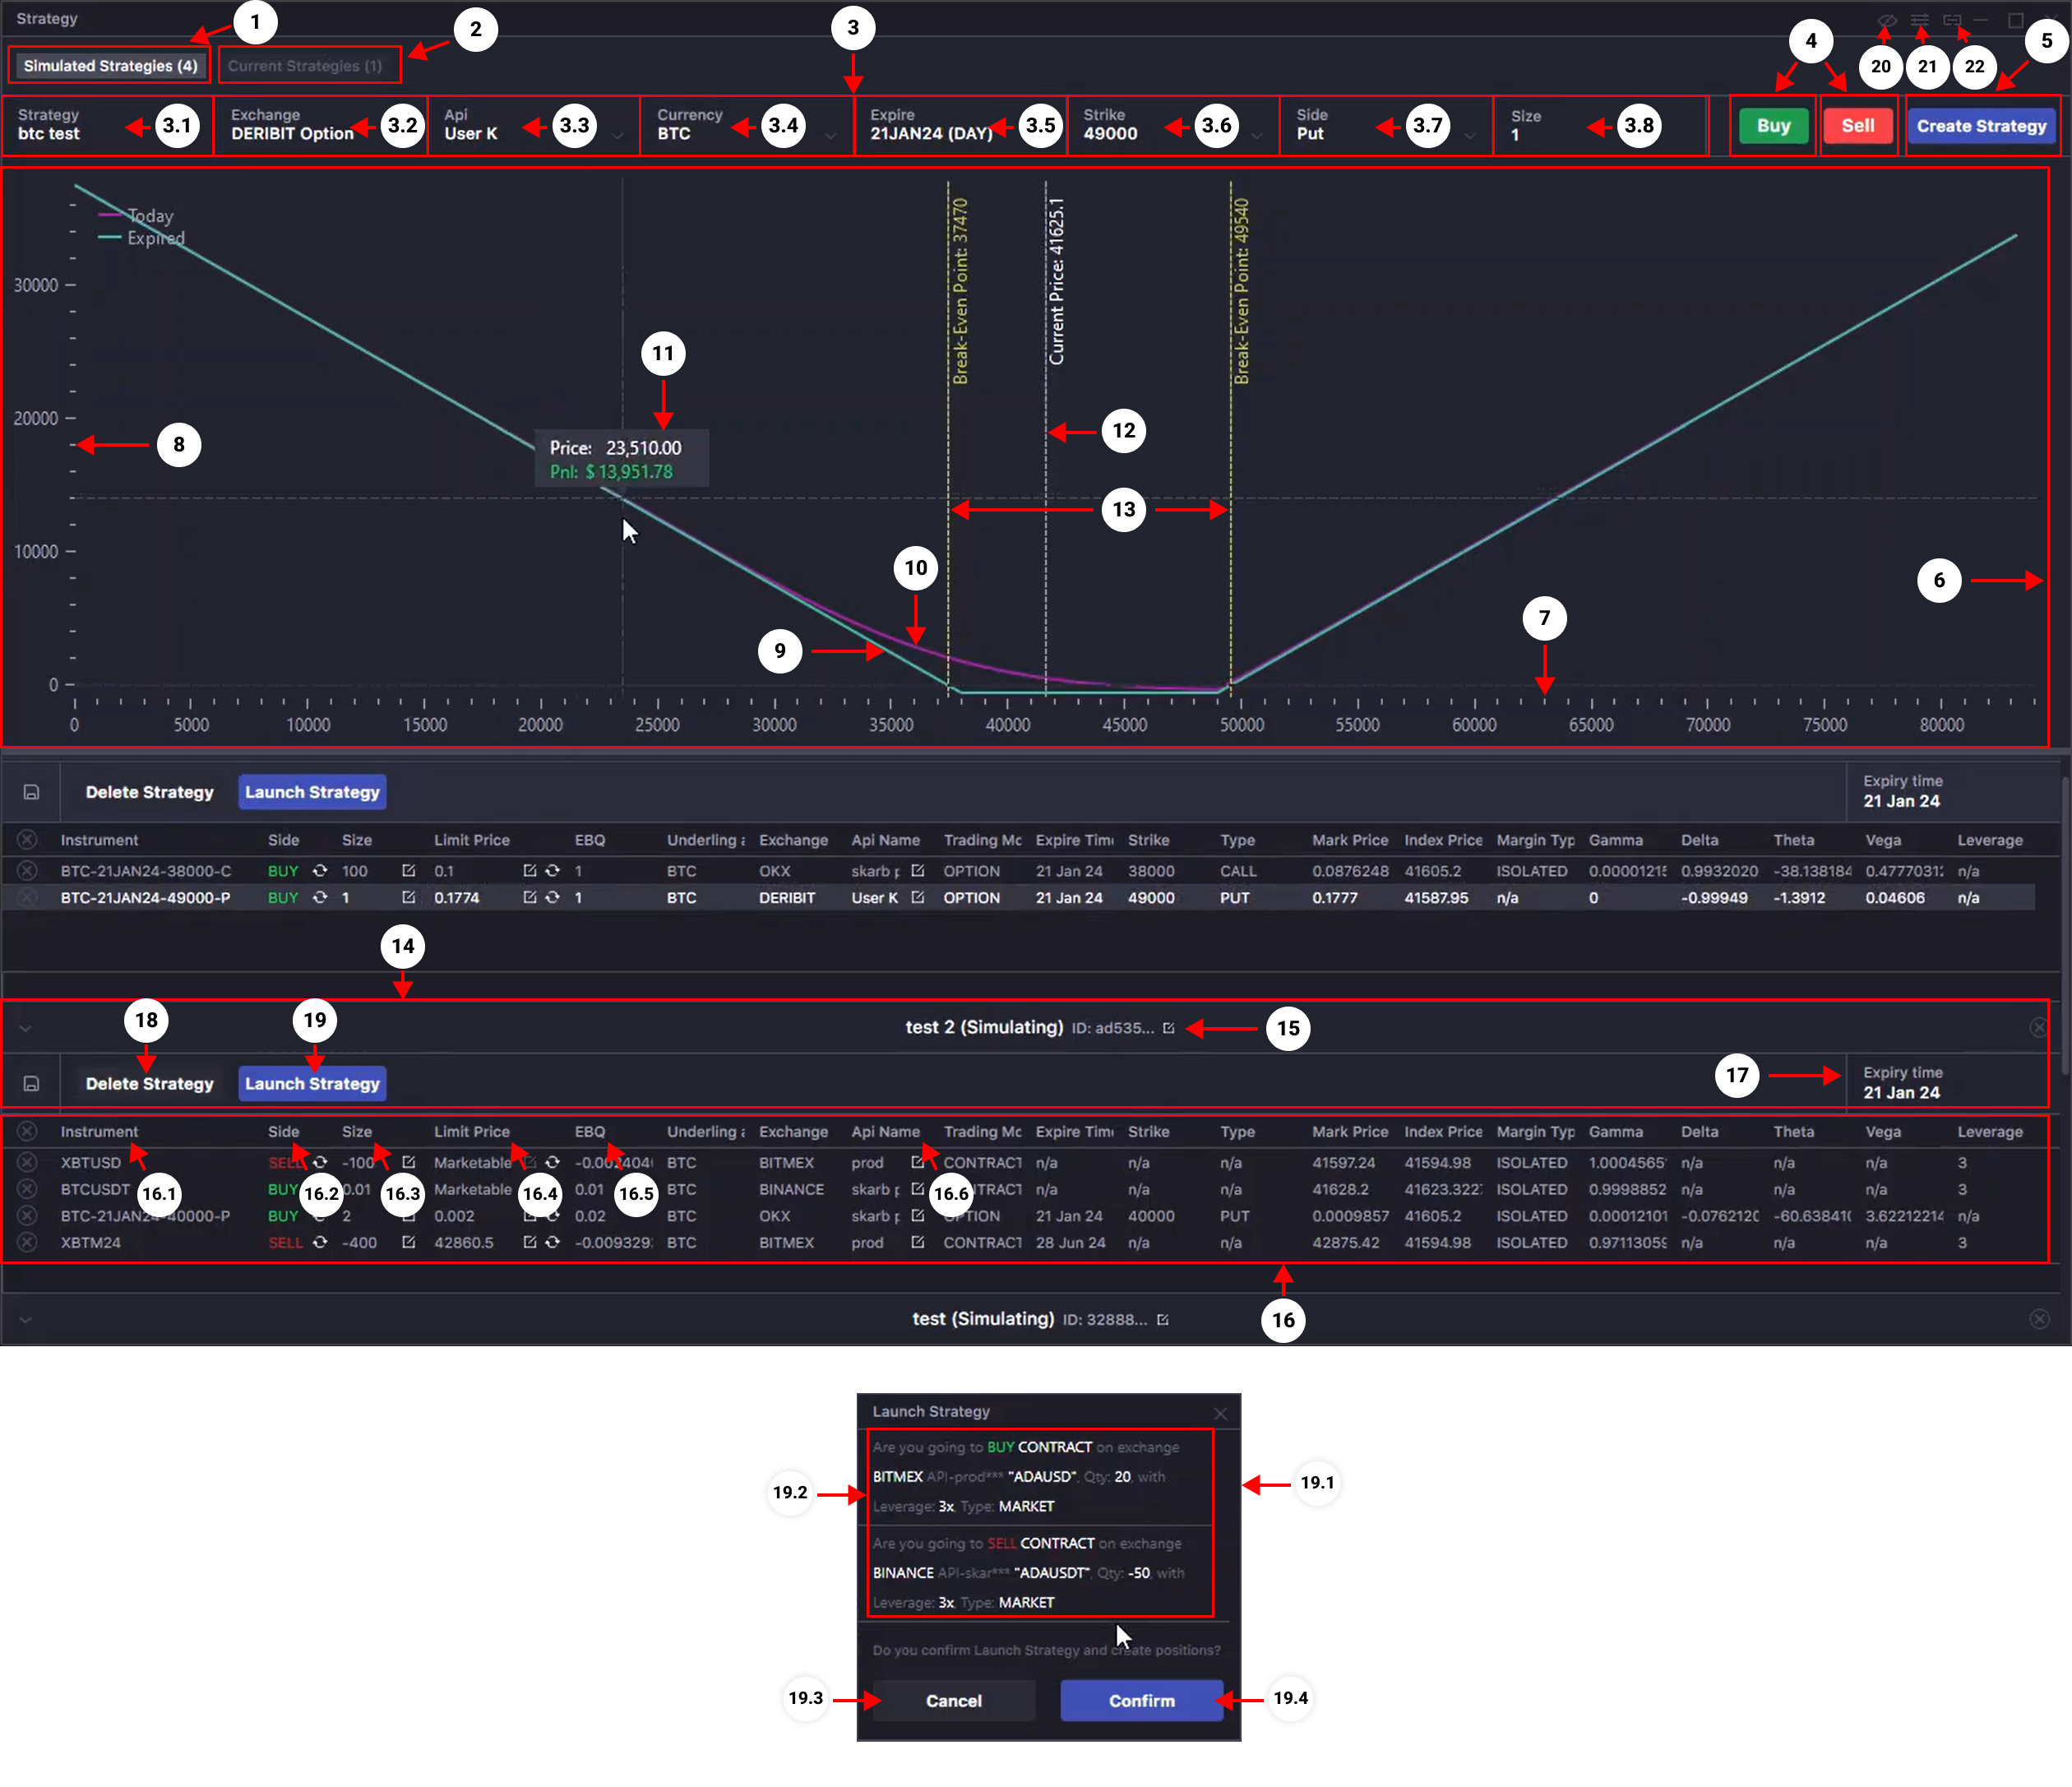
- Tab in the Strategy window where you can construct a Portfolio Strategy based on a single base currency using current market data in simulation mode. Here, you can select the necessary trading instruments and create a Portfolio Strategy based on them. Analyze its profitability. Experiment without actual trading.
- Tab in the Strategy window where open or closed Portfolio Strategies based on a single base currency are displayed. Here, you can view the performance chart of the strategy, analyze it, and manage the Portfolio Strategy. In this tab, you can close current strategies or edit the portfolio's composition.
- Control panel for positions in Portfolio Strategies. Here, you can add a position to an existing Portfolio Strategy or create a new strategy.
- 3.1. Select the Portfolio Strategy to which you wish to add a position in the simulation.
- 3.2. Select the exchange on which the position will be opened in the simulation.
- 3.3. Select the API account on which the position opening will be simulated.
- 3.4. Select the currency of the position.
- 3.5. Select the expiration date of the instrument (for perpetual instruments, this field will be absent).
- 3.6. Select the Strike of the option position (this field will be available only for option contracts).
- 3.7. Select the type of option (this field will be available only for option contracts).
- 3.8. Select the size of the position (amount).
- Select BUY if you want to add a position to LONG in an existing Portfolio Strategy or when creating a new one. Select SELL if you want to add a position to SHORT.
- Button for creating a new Portfolio Strategy. The new strategy will be created based on the first position, the parameters that you selected in the control panel (item 3).
- Performance chart of the portfolio strategy. Here, you can analyze the formed strategy. The strategy's performance is based on the price fluctuations of the underlying asset.
- Price scale of the underlying asset of the strategy on the performance chart.
- Profitability scale of the strategy on the performance chart.
- Profitability chart of the strategy on the expiration date of the strategy (the expiration date is calculated based on the nearest expiration date of one of the trading instruments). (This information is informative and may change).
- Profitability chart of the strategy at the current time. (This information is informative and may change).
- Tooltip with information on the strategy's profitability (profitability scale) at a certain price of the underlying asset (price scale) at a point on the profitability chart. By moving the cursor over the chart, analyze the level of profitability based on the forecasted price and develop your risk management strategy as effectively as possible. (This information is informative and may change).
- A line that indicates the current price of the underlying asset (updated in real-time).
- Breakeven lines of the strategy within the price range of the underlying asset. At the intersection points of these lines with the profitability chart, the strategy's profitability will be zero. These are usually pivotal points where the strategy shifts from profitable to unprofitable, and vice versa.
- Selected Portfolio Strategy Block. Here, you will see a list of strategy positions and their parameters. You can also adjust the necessary position parameters, delete the strategy, or launch it.
- Panel with the name of the selected portfolio strategy. Here, you can rename the strategy and find out the strategy's ID.
- Block with the list of strategy positions (list of trading instruments that form the portfolio). Here, you can view the parameters of the positions and make adjustments to some of them.
- 16.1. Name of the trading instrument.
- 16.2. Position side. Buy if it is a Long position, Sell if it is a Short position. Click the button inside the field to change the position side in the simulation.
- 16.3. Column displaying order amount (Size). Click the button inside the field to change the size of the selected position in the simulation.
- 16.4. Position price in the simulation. If Marketable is selected, the current price of the trading instrument is used to build the strategy's profitability chart.
- 16.5. Column displaying the value of the position in the base currency of the strategy's underlying asset.
- 16.6. Column displaying the API account on which the strategy's position is simulated. When the strategy is launched, this position will be opened on the selected API account. Click the button inside the field to change the API account.
- The expiration date of the selected portfolio strategy. If the strategy consists of perpetual trading instruments, there will be no expiration date (no data). For strategies with instruments that have an expiration date, the expiration date of the portfolio strategy will be calculated based on the nearest instrument's expiration date from the list.
- Click to delete the portfolio strategy.
- Click to launch the portfolio strategy created in the simulation. After launching the strategy, it will disappear from the list of simulated strategies and appear in the Current Strategy tab with real entry prices.
- 19.1. Strategy launch confirmation window. Review the list and parameters of the positions before finalizing the launch of the portfolio strategy.
- 19.2. List of positions and their parameters that will be sent for execution.
- 19.3.Click to cancel the strategy launch.
- 19.4. Click to launch the strategy.
- Toggles "always on top" mode.
- Button for advanced settings of the Strategy window.
- Links the Strategy window with other terminal windows. You can change the linking group by сlicking again on the button, or you can leave the button in the neutral position and the window will not be associated with any link group.